Fig. 9
Download original image
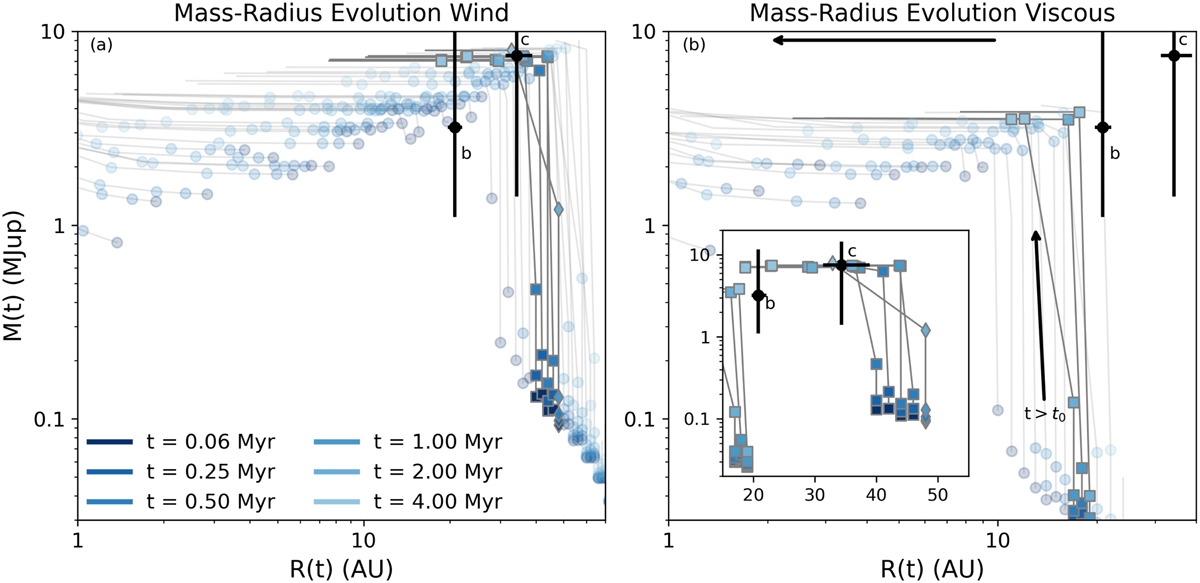
Evolution of synthetic planets in the disk model given by disk-wind evolution (a) and viscous evolution (b). The colour of each point denotes a particular timestep since the begining of the simulation (t0 = 1 Myr). The faded circles are synthetic planets that do not result in PDS 70-like planets at a time of 4 Myr after the beginning of the simulation. The squares show the successful PDS 70b synthetic planets, and the diamonds show the successful PDS 70c planets. The black circles and error bars are the values for PDS 70 b and c, as shown in Table 1. The grey lines connect the points from individual synthetic planets. The wind model can reproduce both planets b and c, although it over estimates the mass of planet b. The viscous model cannot reproduce planet c and underestimates the radial location of planet b. The inset of panel b shows the collection of successful synthetic planets for both the viscous and wind models. See the text for more details.
Current usage metrics show cumulative count of Article Views (full-text article views including HTML views, PDF and ePub downloads, according to the available data) and Abstracts Views on Vision4Press platform.
Data correspond to usage on the plateform after 2015. The current usage metrics is available 48-96 hours after online publication and is updated daily on week days.
Initial download of the metrics may take a while.