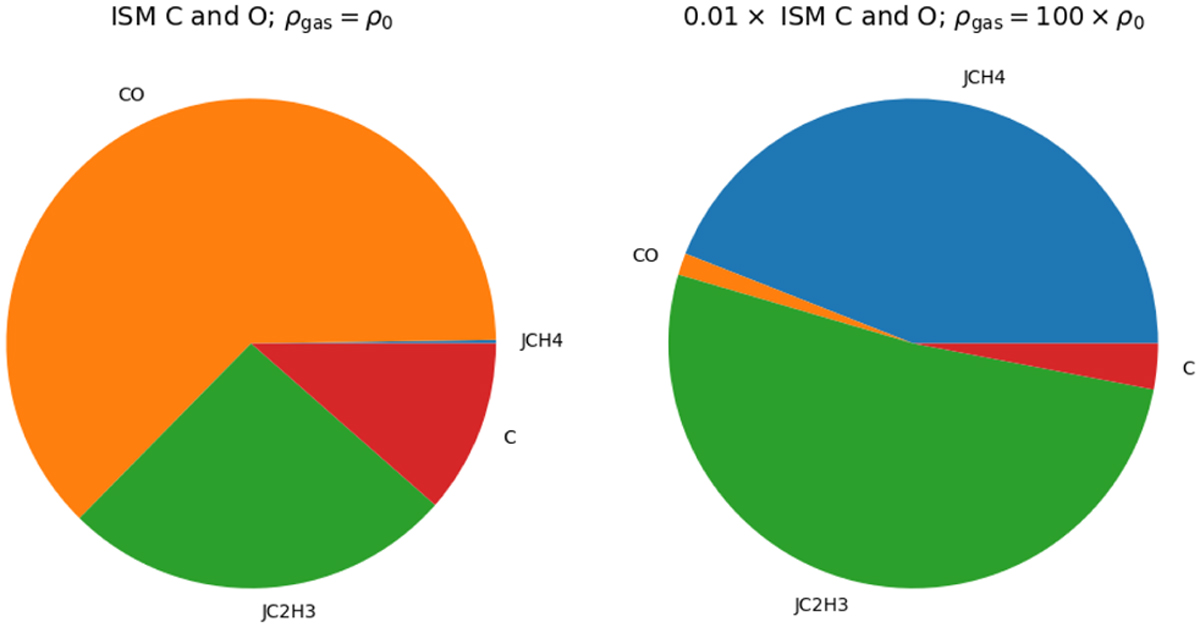
Fig. B.3
Download original image
Most abundant species in the model presented in figure 4(a), (left panel) and the model presented in figure B.1(d), (right panel) for a disk age of 5 Myr. Molecules with a ‘J’ denote species that are frozen onto dust grains. The abundances are integrated between 50 AU and 70 AU (i.e. near the millimeter dust ring) and from the midplane to z/r = 0.43. It therefore includes the main reservoir of CO that contributes to the C18O flux. It is clear that when the abundances of carbon and oxygen are reduced, the main reservoir of carbon is shifted towards hydrocarbons that are frozen onto the dust.
Current usage metrics show cumulative count of Article Views (full-text article views including HTML views, PDF and ePub downloads, according to the available data) and Abstracts Views on Vision4Press platform.
Data correspond to usage on the plateform after 2015. The current usage metrics is available 48-96 hours after online publication and is updated daily on week days.
Initial download of the metrics may take a while.