Fig. 10
Download original image
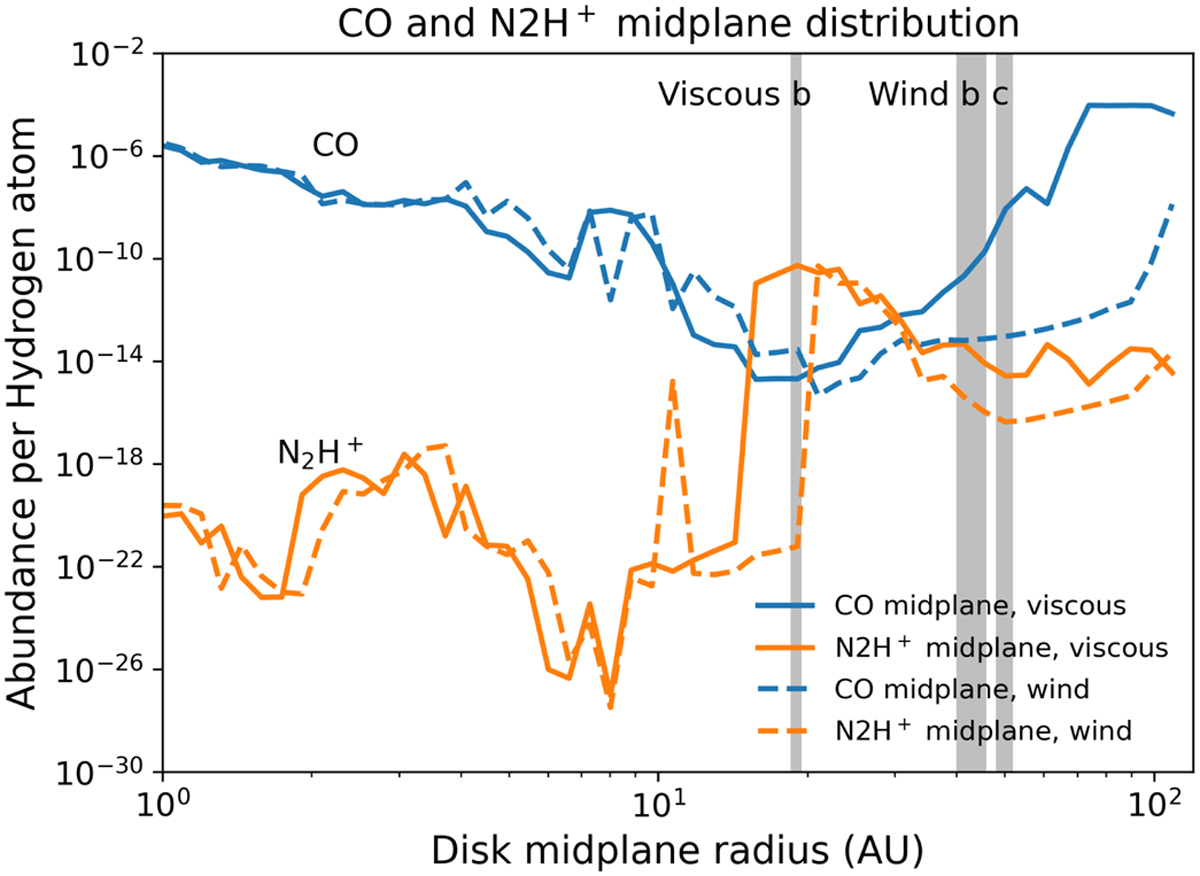
Midplane distribution of molecular abundances for CO and its tracer, N2H+, for the viscous and wind models at 1 Myr. The CO abundance dips for both at the same position as a steep increase in N2H+, which is indicative of the CO ice line. The three grey bands show the range of initial embryo radii that result in the synthetic planets b and c in the viscous and wind models.
Current usage metrics show cumulative count of Article Views (full-text article views including HTML views, PDF and ePub downloads, according to the available data) and Abstracts Views on Vision4Press platform.
Data correspond to usage on the plateform after 2015. The current usage metrics is available 48-96 hours after online publication and is updated daily on week days.
Initial download of the metrics may take a while.