Fig. 5
Download original image
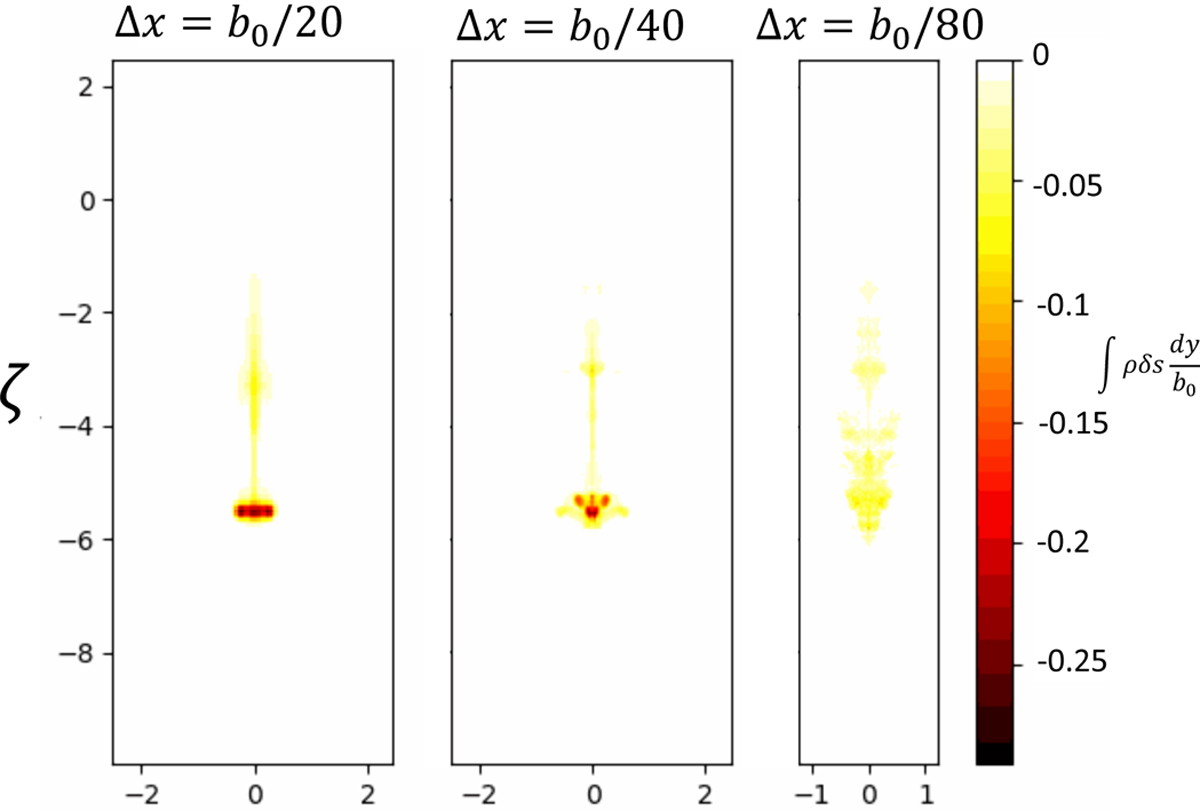
Comparison of a snapshot in time at τ = 8.8 for a sinking bubble simulation with an initial size of b0/H0 = 2/5 for different choices of grid resolution, where ζ ≡ z/b0 is the dimensionless depth. Colors correspond to the integrated line-of-sight specific entropy perturbations, i.e., ∫Y ρδsdy, where δs is defined in Eq. (21), y is the dimension coming out of the page, and Y is its simulated domain. Units on the color bar are arbitrary, linearly proportional to entropy surface density. The dynamical instability observed for Δx ≥ b0/40 is not observed for the lowest-resolution (leftmost) simulation, whose vortex ring remains stable until colliding with the bottom boundary of the simulation.
Current usage metrics show cumulative count of Article Views (full-text article views including HTML views, PDF and ePub downloads, according to the available data) and Abstracts Views on Vision4Press platform.
Data correspond to usage on the plateform after 2015. The current usage metrics is available 48-96 hours after online publication and is updated daily on week days.
Initial download of the metrics may take a while.