Fig. 13
Download original image
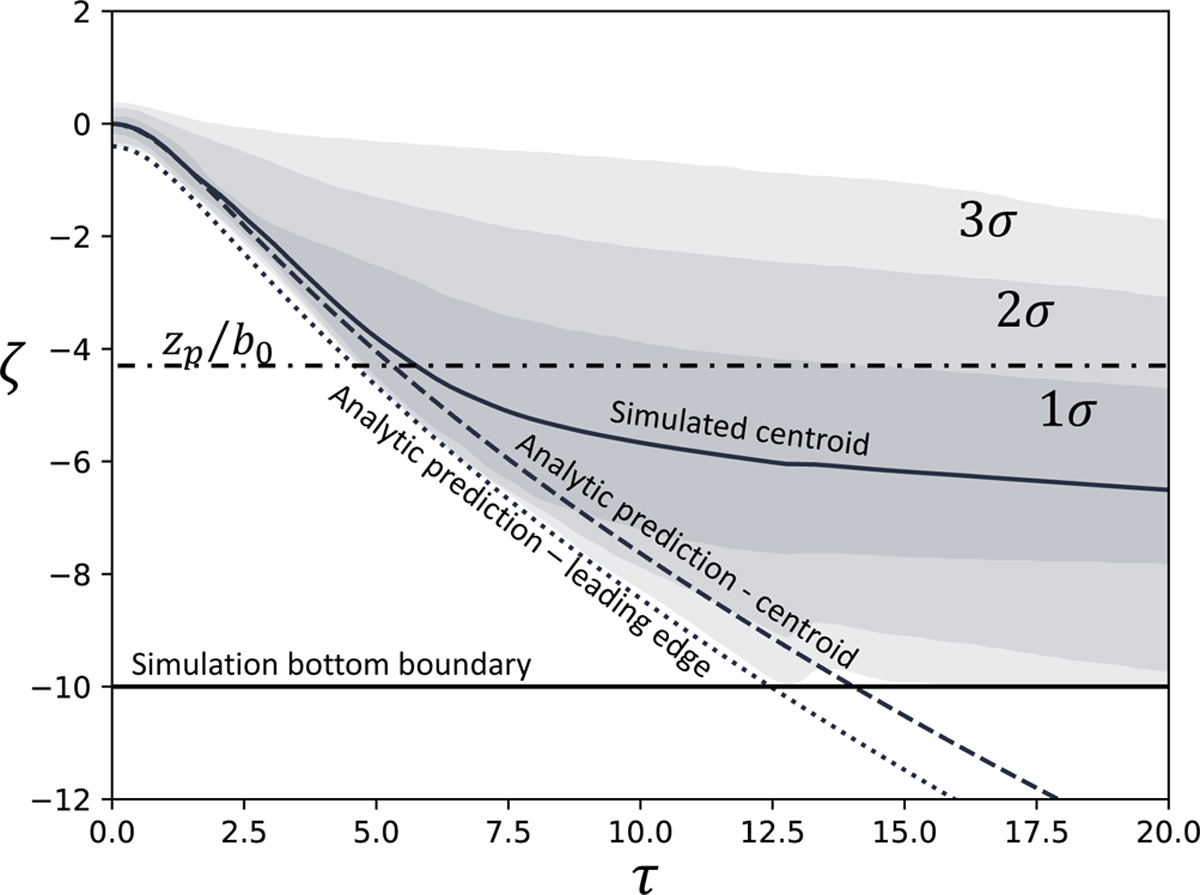
Tracking the centroid along with the 1σ, 2σ, and 3σ shadows, which represent the distribution of material for b0/H0 = 2/5 and Δx = b0/40. The dashed curve represents the subsidence of the centroid, while the dotted line shows the analytical model prediction for the depth of the leading edge of the vortex ring from Sect. 2, zlead ≡ zcentroid + b(z)/2. The solid line represents the bottom boundary of the simulation. We use dimensionless depth, ζ = z/b0, and dimensionless time, τ = t/(b0/g′)1/2. The dashed-dotted line shows the penetration depth, zp, computed using Eq. (26) for reference.
Current usage metrics show cumulative count of Article Views (full-text article views including HTML views, PDF and ePub downloads, according to the available data) and Abstracts Views on Vision4Press platform.
Data correspond to usage on the plateform after 2015. The current usage metrics is available 48-96 hours after online publication and is updated daily on week days.
Initial download of the metrics may take a while.