Fig. 12
Download original image
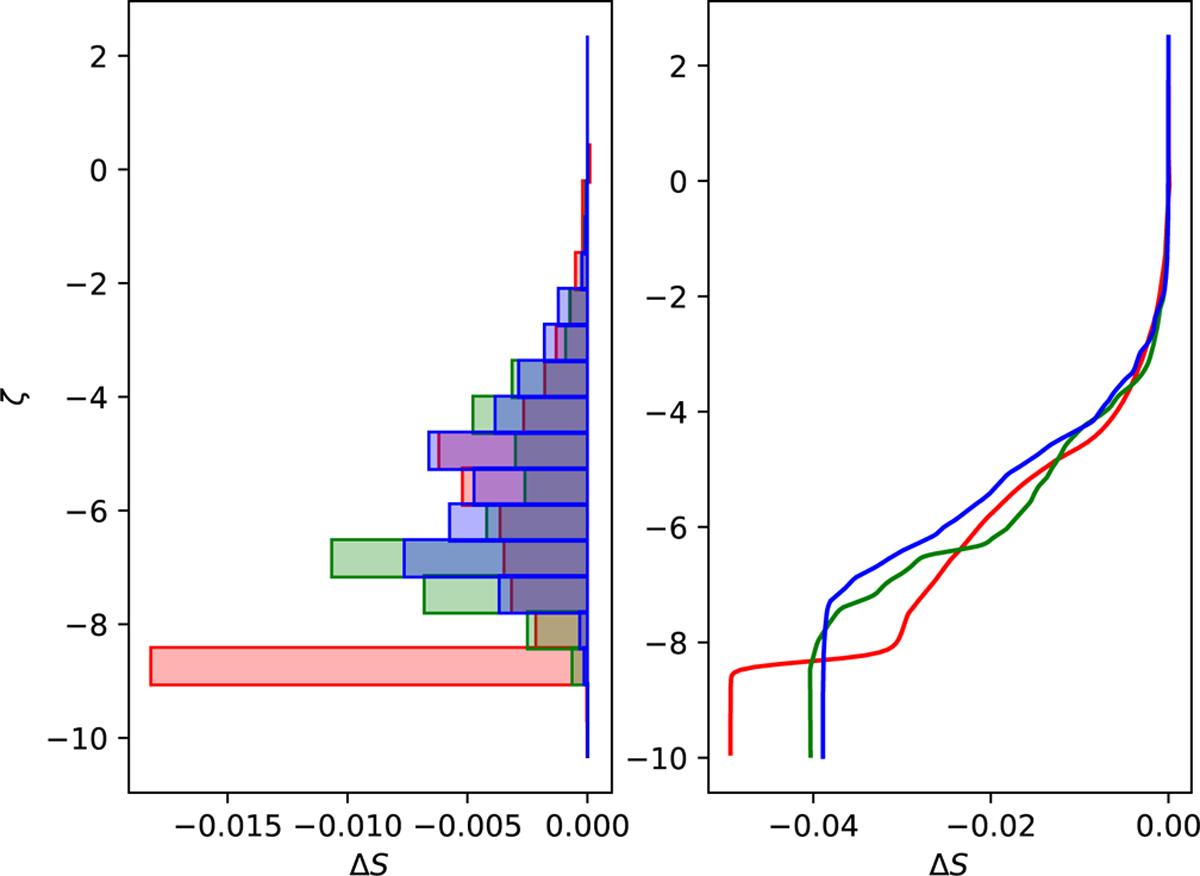
Sample showing a histogram (left) and cumulative distribution (right, integrating from the top) of entropy at a snapshot in time for low-resolution Δx = b0/20 (red), medium-resolution Δx = b0/40 (green), and high-resolution Δx = b0/80. ![]() , where
, where ![]() obeys Eq. (24), either integrating between bin boundaries (left panel) or cumulatively from the simulation top boundary (right panel). Simulation input parameters at the same as in Figs. 7–8.
obeys Eq. (24), either integrating between bin boundaries (left panel) or cumulatively from the simulation top boundary (right panel). Simulation input parameters at the same as in Figs. 7–8.
Current usage metrics show cumulative count of Article Views (full-text article views including HTML views, PDF and ePub downloads, according to the available data) and Abstracts Views on Vision4Press platform.
Data correspond to usage on the plateform after 2015. The current usage metrics is available 48-96 hours after online publication and is updated daily on week days.
Initial download of the metrics may take a while.