Fig. 9
Download original image
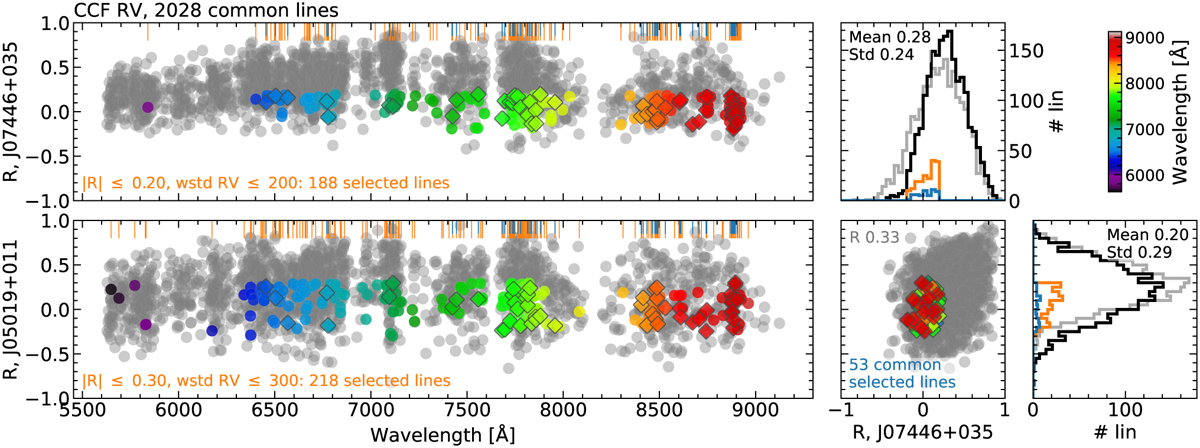
Pearson's correlation coefficient R of the lines analysed as a function of their wavelength for J07446+035 (top left) and J05019+011 (bottom left). Grey dots show lines not selected, coloured dots show lines selected by the specific cut indicated in the orange text, and coloured diamonds indicate selected lines common to both targets. Data points are colour-coded with wavelength. Vertical orange lines at the top of the panels indicate the position of the selected lines, and blue lines indicate those common in both stars. The bottom middle panel shows the correlation between J07446+035 and J05019+011 R values. Grey dots show all lines not selected in any of the targets plus lines selected but not common (i.e. grey and coloured dots in the left panels), and coloured diamonds indicate selected lines common in both stars (same as in the left panels). Histograms at the right show the distribution of R values of each star (J07446+035 top, J05019+011 bottom). The black histogram shows the distribution of all lines, the orange one, lines selected by the cut indicated in the left panels, and the blue one, selected lines common in both stars. The grey histogram shows the distribution of all lines for the other star, for comparison.
Current usage metrics show cumulative count of Article Views (full-text article views including HTML views, PDF and ePub downloads, according to the available data) and Abstracts Views on Vision4Press platform.
Data correspond to usage on the plateform after 2015. The current usage metrics is available 48-96 hours after online publication and is updated daily on week days.
Initial download of the metrics may take a while.