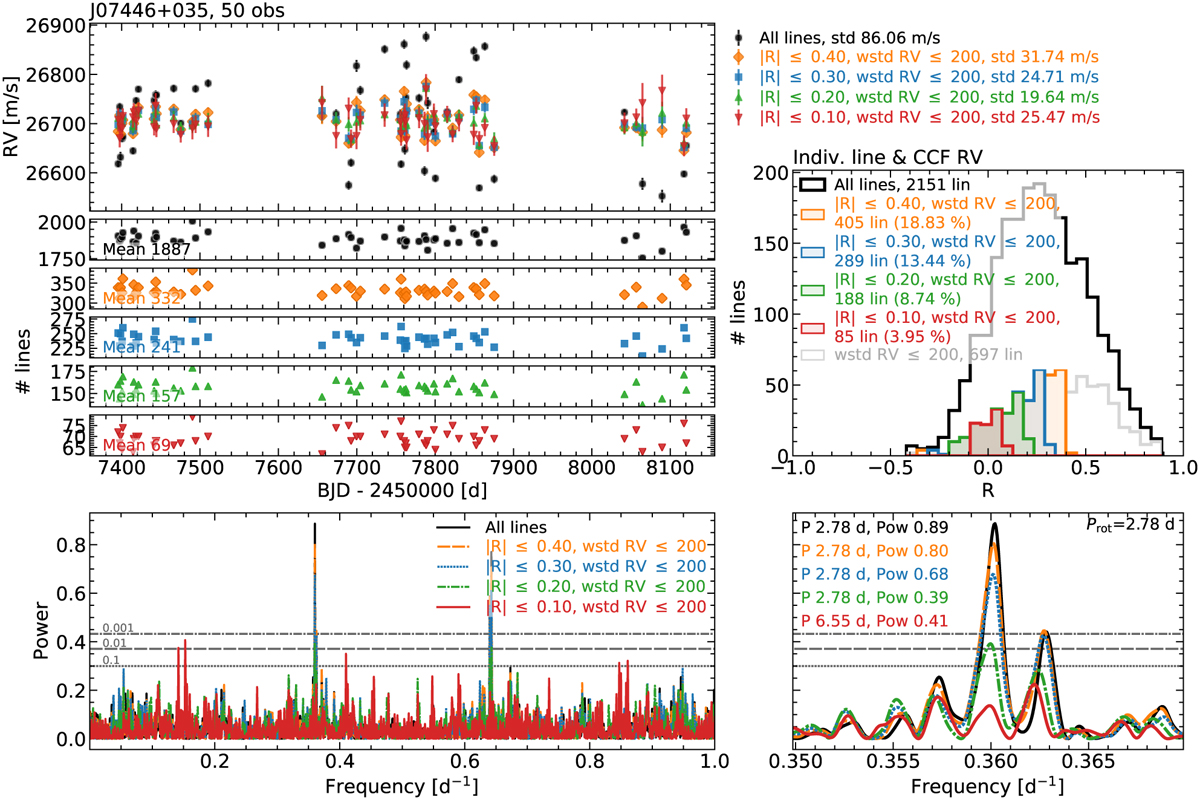
Fig. 7
Download original image
Line-by-line results obtained using inactive lines for J07446+035 (YZ CMi). Top left: LAV RV time series obtained using RVs of selected inactive individual lines (colour), together with the LAV RV time series obtained using all the lines (black). The lines are selected based on the correlation of their RVs with the total spectrum RV, and their scatter. Middle left: number of lines used to compute the average RV in each observation, for the different selection of lines used in the top left panel. Top right: distribution of the Pearson's correlation coefficient R from the correlation between the individual line RVs and the total spectrum RV. The regions in colour indicate the different selection of lines used to compute the RVs of the top left panel. Additionally, we show in grey the distribution of R values after applying only the cut in line RV scatter (wstd). Bottom left: periodograms of the RV datasets plotted on the top left panel. The horizontal lines correspond to the 0.1, 0.01, and 0.001 FAP levels, respectively. Bottom right: zoom in of the periodogram region around the peak corresponding to the rotation period of the star. The text indicates the period and power of the highest peak of each periodogram.
Current usage metrics show cumulative count of Article Views (full-text article views including HTML views, PDF and ePub downloads, according to the available data) and Abstracts Views on Vision4Press platform.
Data correspond to usage on the plateform after 2015. The current usage metrics is available 48-96 hours after online publication and is updated daily on week days.
Initial download of the metrics may take a while.