Fig. 5
Download original image
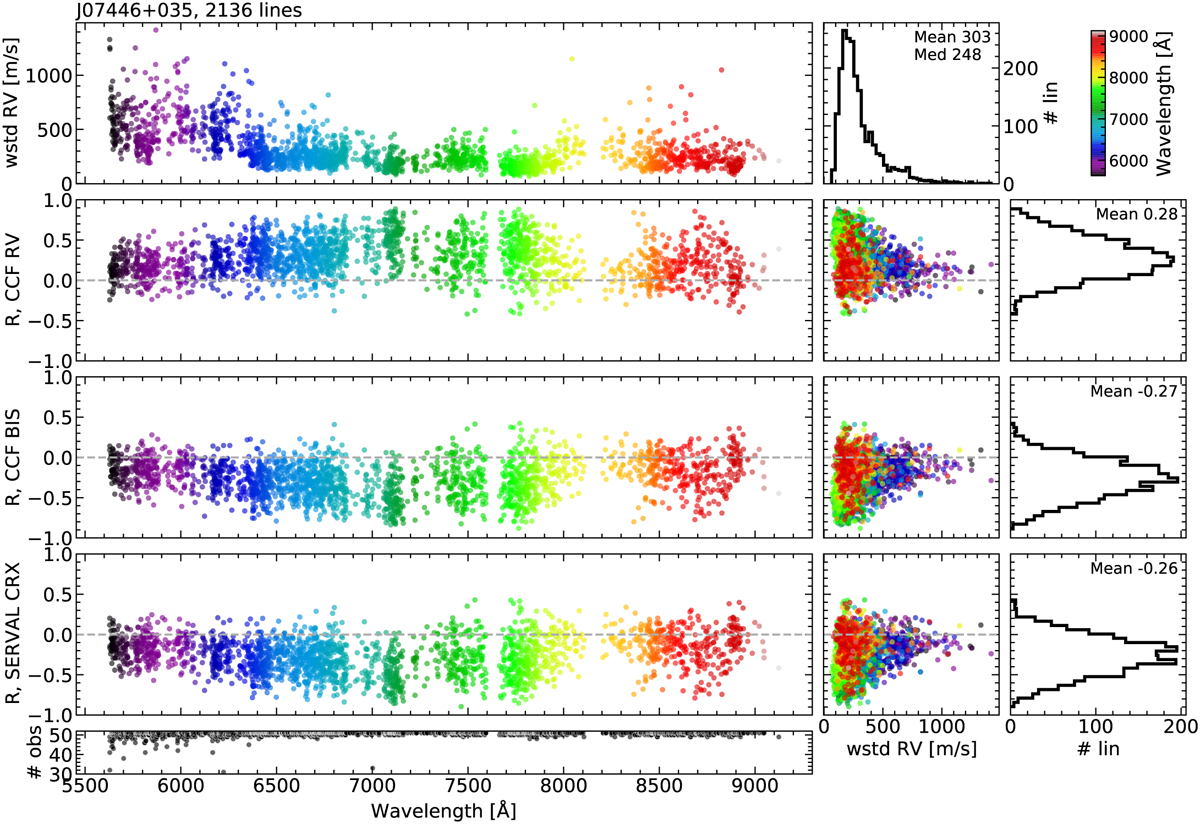
RV scatter of each line (computed as the weighted standard deviation of the line RV of all the observations, wstd RV), and Pearson's correlation coefficient R as a function of the wavelength, for the correlation with CCF RV, BIS, and CRX (top to bottom left panels) for J07446+0355 (YZ CMi). All data points are colour-coded with the wavelength. The middle panels show the correlation between the corresponding R and the wstd RV. The histograms on the right show the distribution of R. The top middle histogram shows the distribution of wstd RV. The bottom left panel shows the number of observations used per line.
Current usage metrics show cumulative count of Article Views (full-text article views including HTML views, PDF and ePub downloads, according to the available data) and Abstracts Views on Vision4Press platform.
Data correspond to usage on the plateform after 2015. The current usage metrics is available 48-96 hours after online publication and is updated daily on week days.
Initial download of the metrics may take a while.