Fig. 3
Download original image
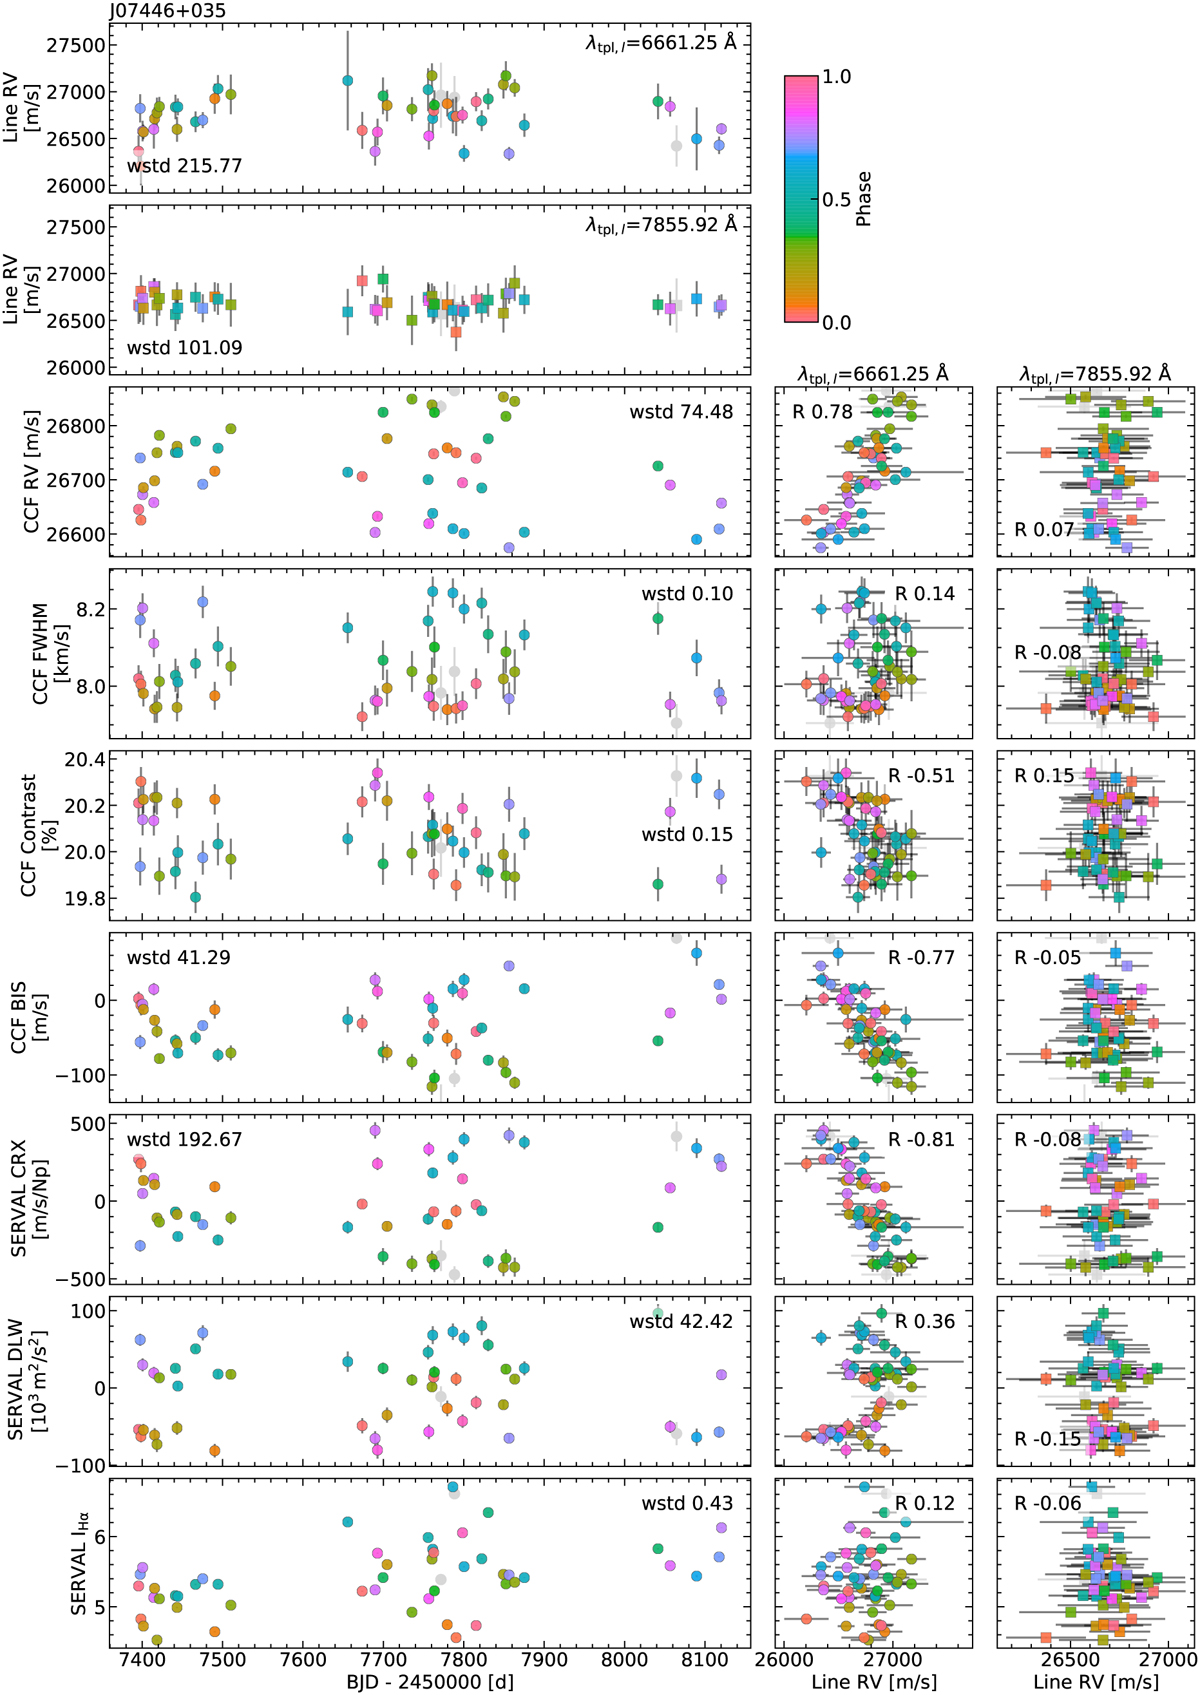
Time series RV of an 'active' (λtpl,l = 6661.25 Å, top left, dots) and 'inactive' (λtpl,l = 7855.92 Å, top left, squares) line for J07446+035 (YZ CMi). The panels below show the time series of the CCF RV, FWHM, contrast, and BIS, and the CRX, dLW, and IHα computed by serval (left), together with their correlation with the RV of the individual line (middle and right). The text in the time series panels shows the scatter of the data, computed as their weighted standard deviation (wstd). The text in the correlation panels shows the Pearson's correlation coefficient (R). All data points are colour-coded with the stellar rotation phase. Observations removed as explained in Sect. 3.3 are marked in grey.
Current usage metrics show cumulative count of Article Views (full-text article views including HTML views, PDF and ePub downloads, according to the available data) and Abstracts Views on Vision4Press platform.
Data correspond to usage on the plateform after 2015. The current usage metrics is available 48-96 hours after online publication and is updated daily on week days.
Initial download of the metrics may take a while.