Fig. A.1
Download original image
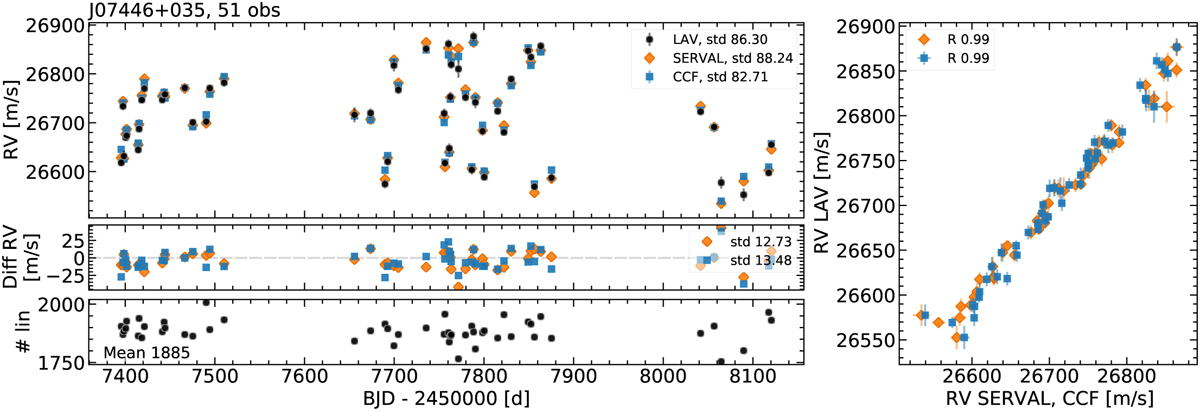
Comparison of global RV time series. Top left: RV time series of J07446+035 (YZ CMi, GJ 285) computed with the average of all the individual line RVs (LAV, black dots), serval (orange diamonds), and CCF (blue squares). Middle left: Difference between the LAV and the serval (orange diamonds) and CCF (blue squares) RVs. Bottom left: Number of lines used per observation. Right: Correlation between the LAV and the serval (orange diamonds) and CCF (blue squares) RVs.
Current usage metrics show cumulative count of Article Views (full-text article views including HTML views, PDF and ePub downloads, according to the available data) and Abstracts Views on Vision4Press platform.
Data correspond to usage on the plateform after 2015. The current usage metrics is available 48-96 hours after online publication and is updated daily on week days.
Initial download of the metrics may take a while.