Fig. 1
Download original image
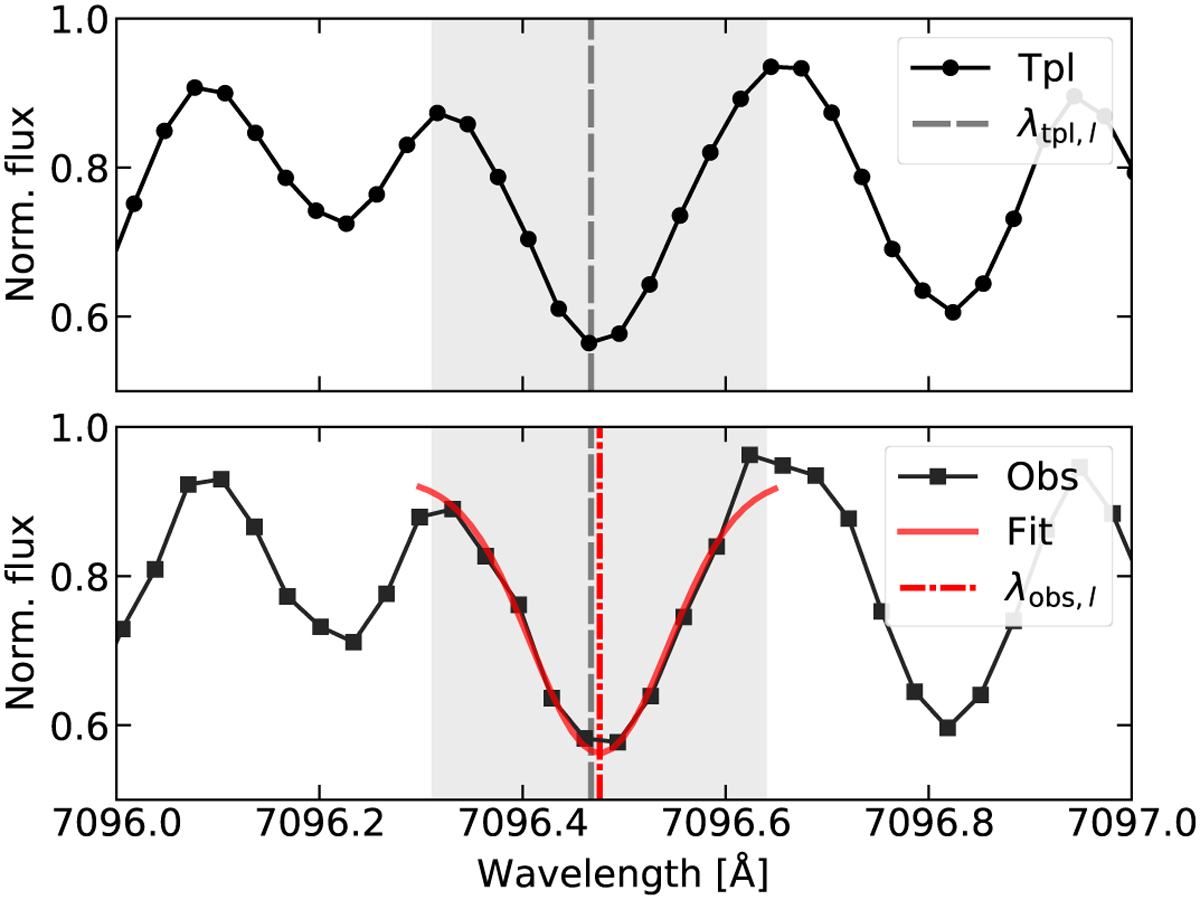
RV computation of a representative individual line. The dashed grey vertical line represents the wavelength of the line l in the line list, as measured in the spectrum template (black dots, in this example, λtpl,l = 7096.4675 Å). The dash-dotted red vertical line represents the wavelength of the line l measured in an observation (black squares) with a Gaussian fit to the line (solid red line, in this example, λobs,l = 7096.4761 Å). The shaded grey region marks the data points considered in the Gaussian fit to the spectrum. The Doppler shift computed with Eq. (1) in this case is of 363 m s−1.
Current usage metrics show cumulative count of Article Views (full-text article views including HTML views, PDF and ePub downloads, according to the available data) and Abstracts Views on Vision4Press platform.
Data correspond to usage on the plateform after 2015. The current usage metrics is available 48-96 hours after online publication and is updated daily on week days.
Initial download of the metrics may take a while.