Fig. E.3.
Download original image
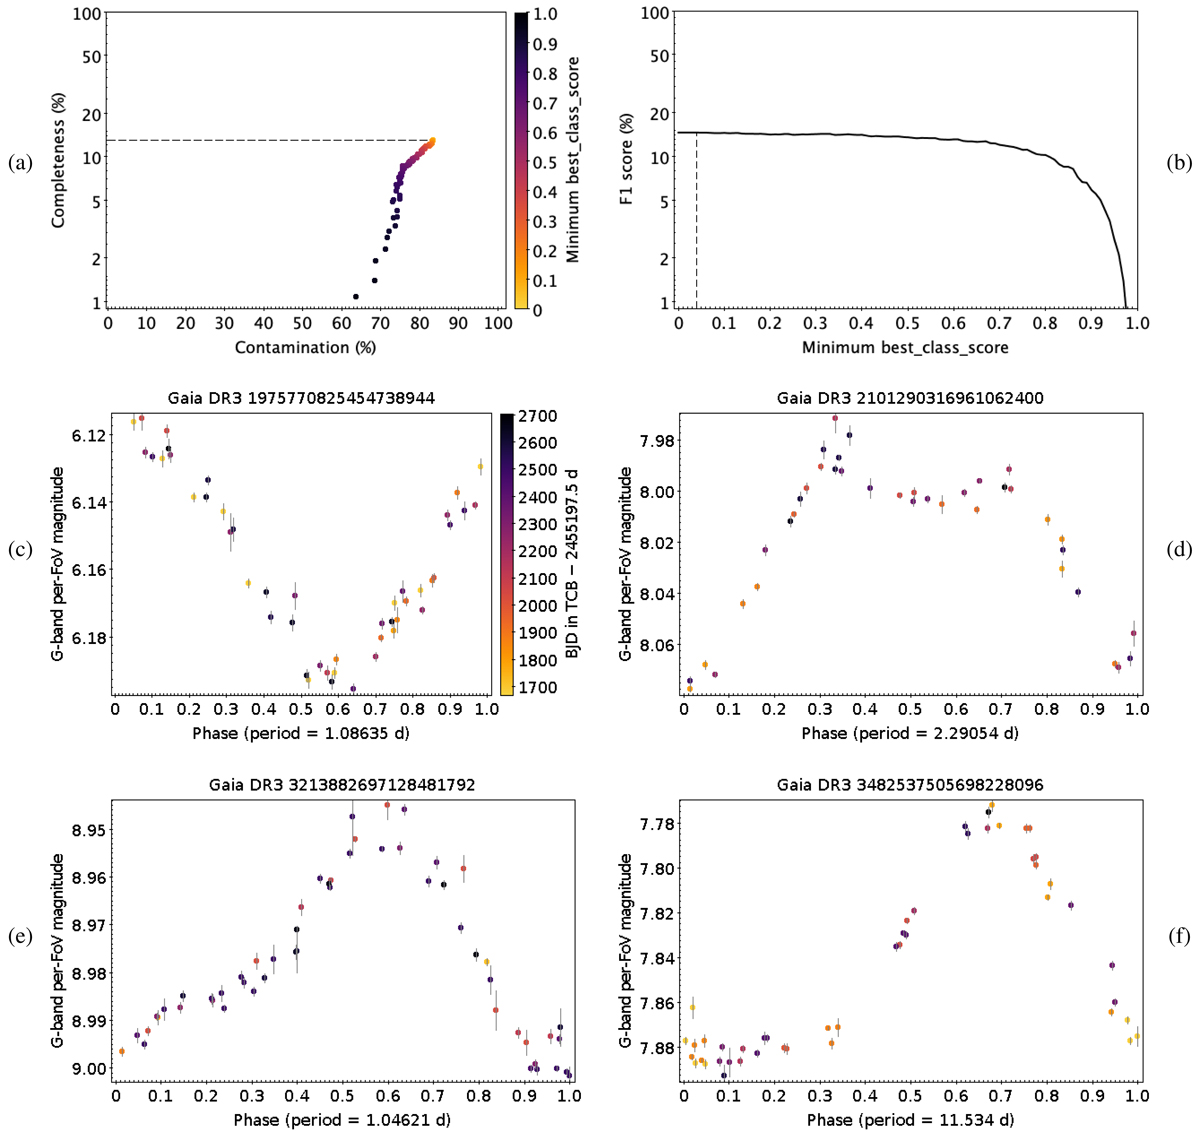
ACV|CP|MCP|ROAM|ROAP|SXARI: completeness, contamination, F1-score, and sample light curves. The dashed lines indicate the maximum completeness (with minimum best_class_score of zero) in panel (a) and the minimum best_class_score that maximises the F1-score (for an optimal balance between completeness and contamination) in panel (b). For all period-folded light curves, times are colour-coded according to the same legend as shown in panel (c).
Current usage metrics show cumulative count of Article Views (full-text article views including HTML views, PDF and ePub downloads, according to the available data) and Abstracts Views on Vision4Press platform.
Data correspond to usage on the plateform after 2015. The current usage metrics is available 48-96 hours after online publication and is updated daily on week days.
Initial download of the metrics may take a while.