Fig. 9
Download original image
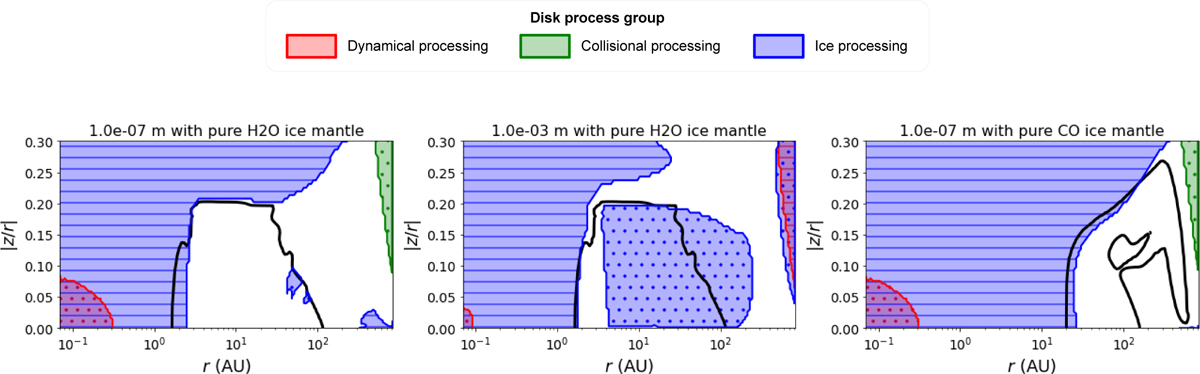
Process coupling behaviour for different grain sizes and ice mantle compositions. Colored areas indicate the decoupling of the different timescale groups. The filling of the coloured areas with solid lines or dots indicate the decoupling of a process category since it is much faster or slower, respectively. Black lines indicate icelines (τads = τdes).
Current usage metrics show cumulative count of Article Views (full-text article views including HTML views, PDF and ePub downloads, according to the available data) and Abstracts Views on Vision4Press platform.
Data correspond to usage on the plateform after 2015. The current usage metrics is available 48-96 hours after online publication and is updated daily on week days.
Initial download of the metrics may take a while.