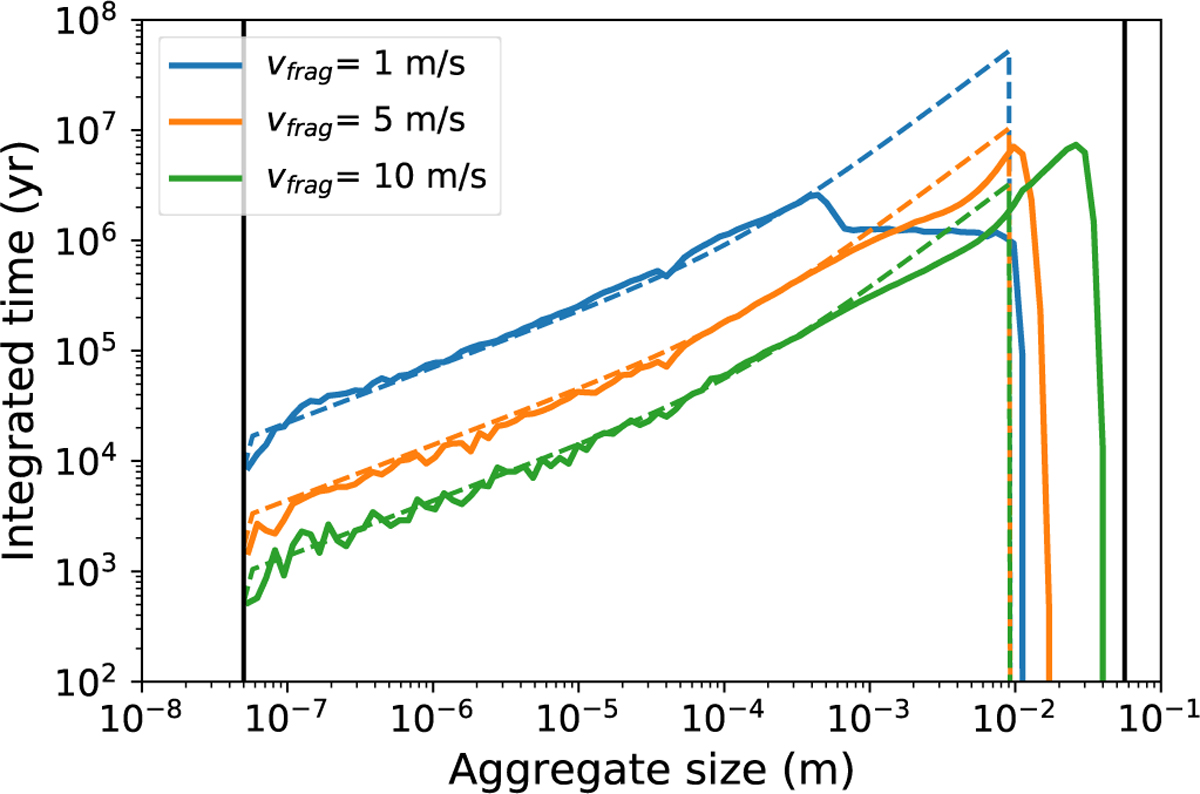
Fig. 4
Download original image
Integrated monomer residence time as a function of home aggregate size for different fragmentation velocities (solid coloured lines). The solid black lines on the left and right represent the minimum and maximum grain size occurring throughout the entire vFrag5 background disk model. The dashed lines all denote the same background dust mass distribution as a function of size, ρd(a) at r = 10 AU and z = 0, shifted vertically for comparison with the integrated monomer residence time.
Current usage metrics show cumulative count of Article Views (full-text article views including HTML views, PDF and ePub downloads, according to the available data) and Abstracts Views on Vision4Press platform.
Data correspond to usage on the plateform after 2015. The current usage metrics is available 48-96 hours after online publication and is updated daily on week days.
Initial download of the metrics may take a while.