Fig. 3
Download original image
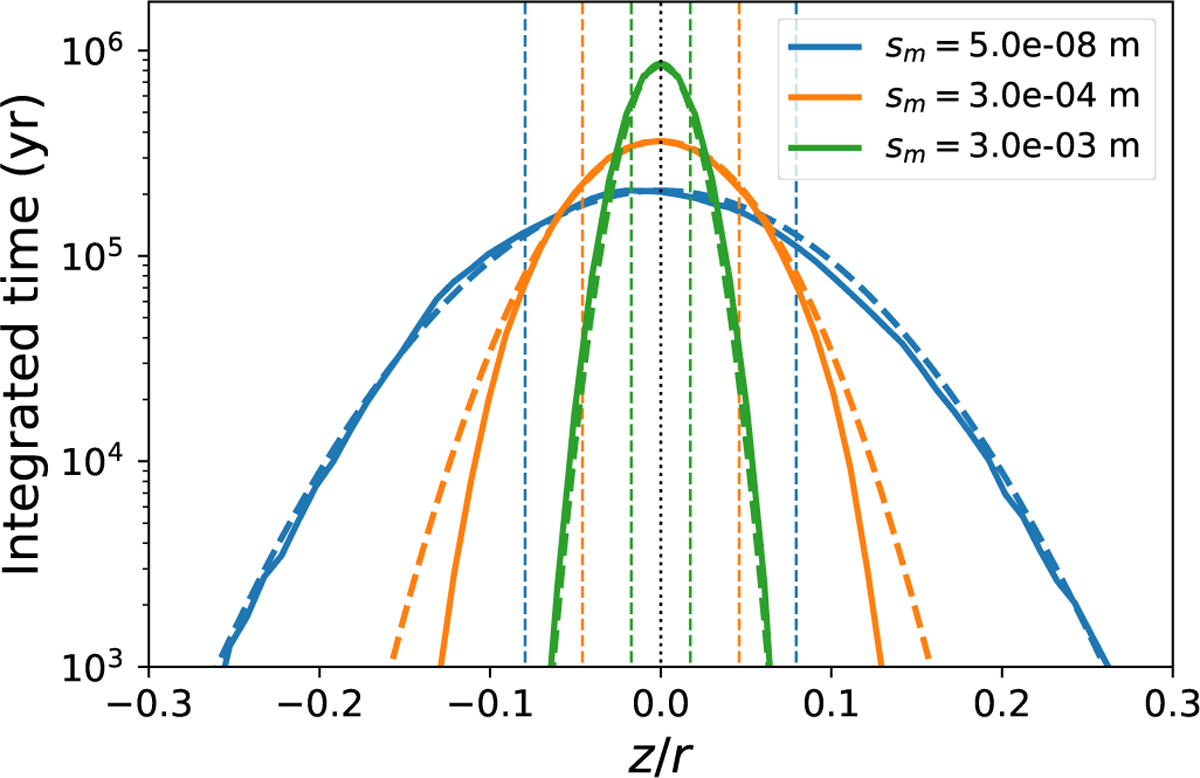
Integrated residence time for monomers of sm = 5 × 10⁻⁸ m (blue), 3 × 10⁻⁴ m (orange), and 3 × 10⁻³ m (green) as a function of height z at r = 10 AU. The solid lines denote the histogram obtained from the trajectories of 103 monomers combined, whereas the dashed lines are the theoretical vertical density profiles expected from Eq. (8). The vertical dashed lines depict the locations where z = Hd for each monomer size.
Current usage metrics show cumulative count of Article Views (full-text article views including HTML views, PDF and ePub downloads, according to the available data) and Abstracts Views on Vision4Press platform.
Data correspond to usage on the plateform after 2015. The current usage metrics is available 48-96 hours after online publication and is updated daily on week days.
Initial download of the metrics may take a while.