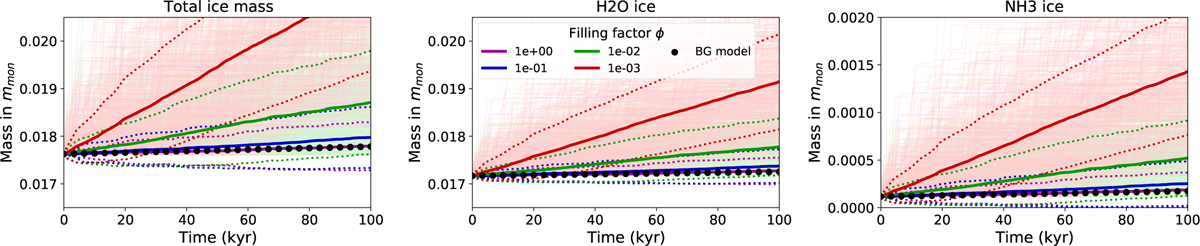
Fig. 14
Download original image
Evolution of the total amount of ice (left panel), H2O ice (center), and NH3 (right) averaged over 500 monomers for different home aggregate filling factors. Solid lines indicate the mean of the 500 monomers, whereas dotted lines indicate the standard deviation. The black dots indicate the ice evolution behaviour predicted by ProDiMo for the vFrag5-model. Trajectories of individual monomers are also shown in the background.
Current usage metrics show cumulative count of Article Views (full-text article views including HTML views, PDF and ePub downloads, according to the available data) and Abstracts Views on Vision4Press platform.
Data correspond to usage on the plateform after 2015. The current usage metrics is available 48-96 hours after online publication and is updated daily on week days.
Initial download of the metrics may take a while.