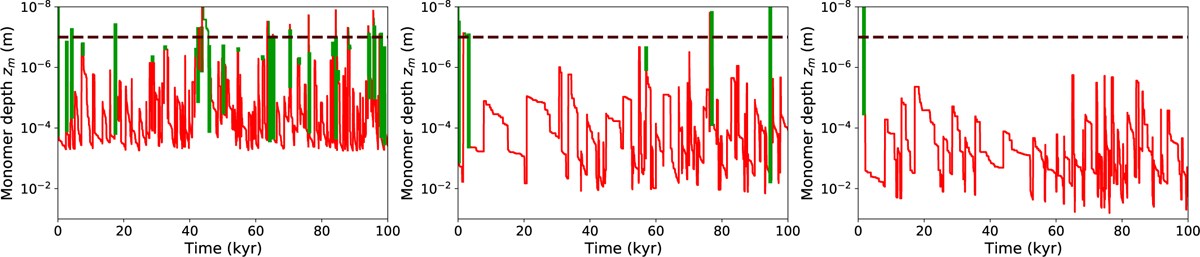
Fig. 12
Download original image
Evolution of monomer depth zm for monomers embedded in home aggregates with υfrag = 1 m s−4 (left), 5 m s−1 (center), and 10 m s−1 (right). Green areas denote the times at which the monomer is exposed to gas phase molecules and UV photons, while the monomer is shielded from impinging molecules and UV photons otherwise. In each panel, the dashed line indicates zm = zcrit.
Current usage metrics show cumulative count of Article Views (full-text article views including HTML views, PDF and ePub downloads, according to the available data) and Abstracts Views on Vision4Press platform.
Data correspond to usage on the plateform after 2015. The current usage metrics is available 48-96 hours after online publication and is updated daily on week days.
Initial download of the metrics may take a while.