Fig. 10
Download original image
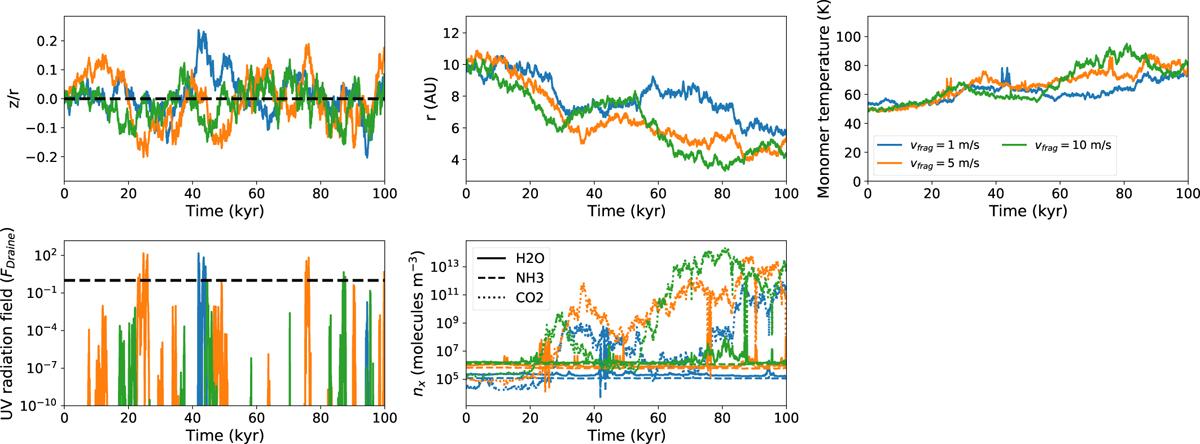
Evolution of the vertical positions (upper left panel), radial positions (upper center panel), temperatures (upper right panel), local UV fluxes (lower left), and local molecular number density in the gas phase (lower center) for monomers in home aggregates with different fragmentation velocity υfrag, released from r = 10 AU and z/r = 0. The black dashed line in the lower left panel indicates a UV radiation field strength of 1 FDraine. Linestyles in the lower center panel indicate number densities of different gas phase species.
Current usage metrics show cumulative count of Article Views (full-text article views including HTML views, PDF and ePub downloads, according to the available data) and Abstracts Views on Vision4Press platform.
Data correspond to usage on the plateform after 2015. The current usage metrics is available 48-96 hours after online publication and is updated daily on week days.
Initial download of the metrics may take a while.