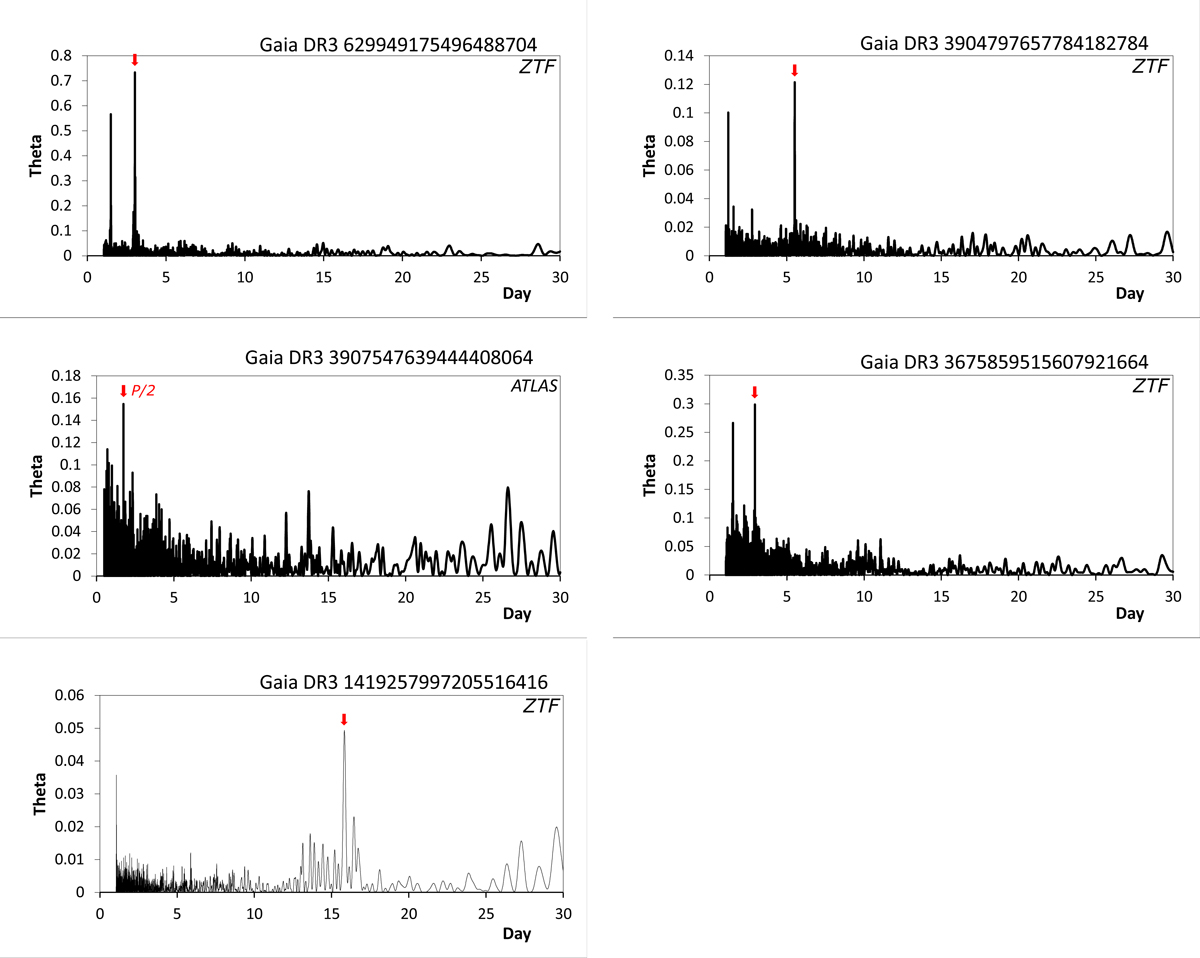
Fig. A.1.
Download original image
Fourier spectra of the five photometrically variable CP2 stars. The data source (ZTF or ATLAS) is indicated in the upper right corner of each panel. In the case of Gaia DR3 3907547639444408064, the highest peak corresponds to half the true rotational period. For all other objects, the rotational periods correspond to the highest peaks (indicated by the red arrow in each panel).
Current usage metrics show cumulative count of Article Views (full-text article views including HTML views, PDF and ePub downloads, according to the available data) and Abstracts Views on Vision4Press platform.
Data correspond to usage on the plateform after 2015. The current usage metrics is available 48-96 hours after online publication and is updated daily on week days.
Initial download of the metrics may take a while.