Fig. 6
Download original image
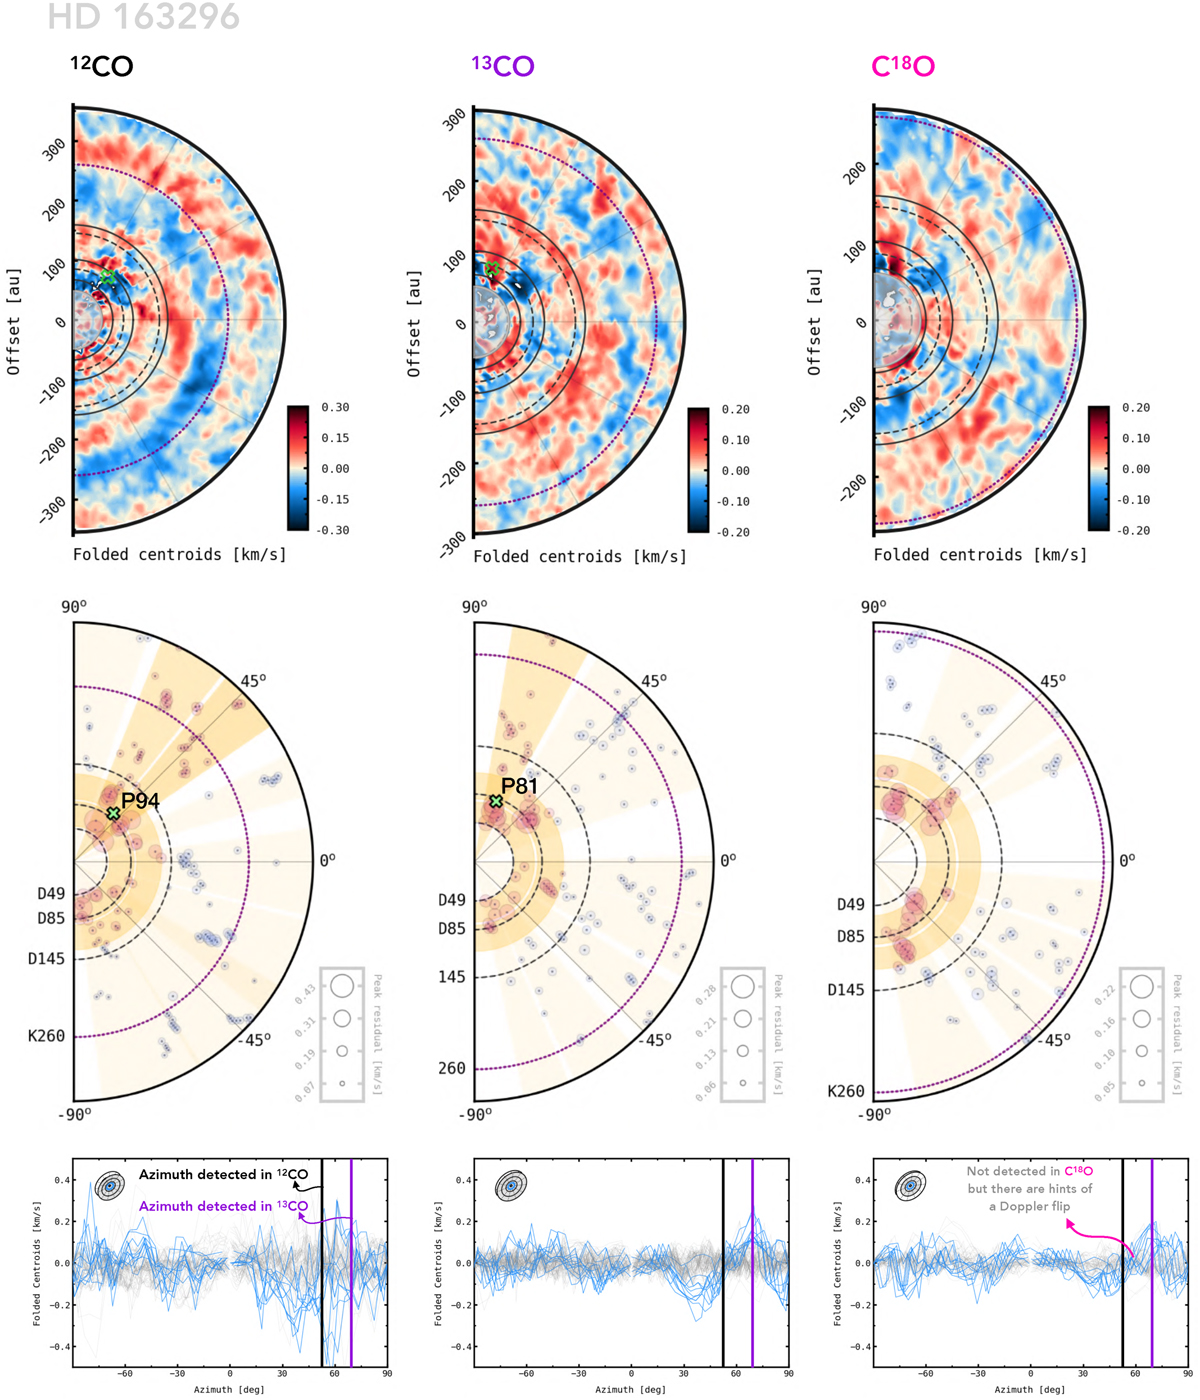
Analysis of localised velocity perturbations in the gas disc of HD 163296. Top row: folded velocity residuals computed for 12CO, 13CO, and C18O J = 2−1 lines. Middle row: azimuthal and radial extent of clusters identified by our detection algorithm. Regions in bold yellow highlight the accepted clusters of peak residuals whose variances are significantly greater than those in the background clusters. The weighted average of the 2D location of peak residuals within azimuthal and radial clusters determines the centre of the localised velocity perturbations reported in the text. These are marked as green crosses for 12CO and 13CO. In C18O, only radial clusters were identified as localised by the technique and, therefore, no perturbation was tagged as detected in this tracer. Bottom row: azimuthal profiles of folded velocities (i.e. those in the top row) to highlight the blue- redshifted, or Doppler flip, morphology of the perturbations detected in 12CO and 13CO, and of the tentative perturbation in C18O.
Current usage metrics show cumulative count of Article Views (full-text article views including HTML views, PDF and ePub downloads, according to the available data) and Abstracts Views on Vision4Press platform.
Data correspond to usage on the plateform after 2015. The current usage metrics is available 48-96 hours after online publication and is updated daily on week days.
Initial download of the metrics may take a while.