Fig. 3
Download original image
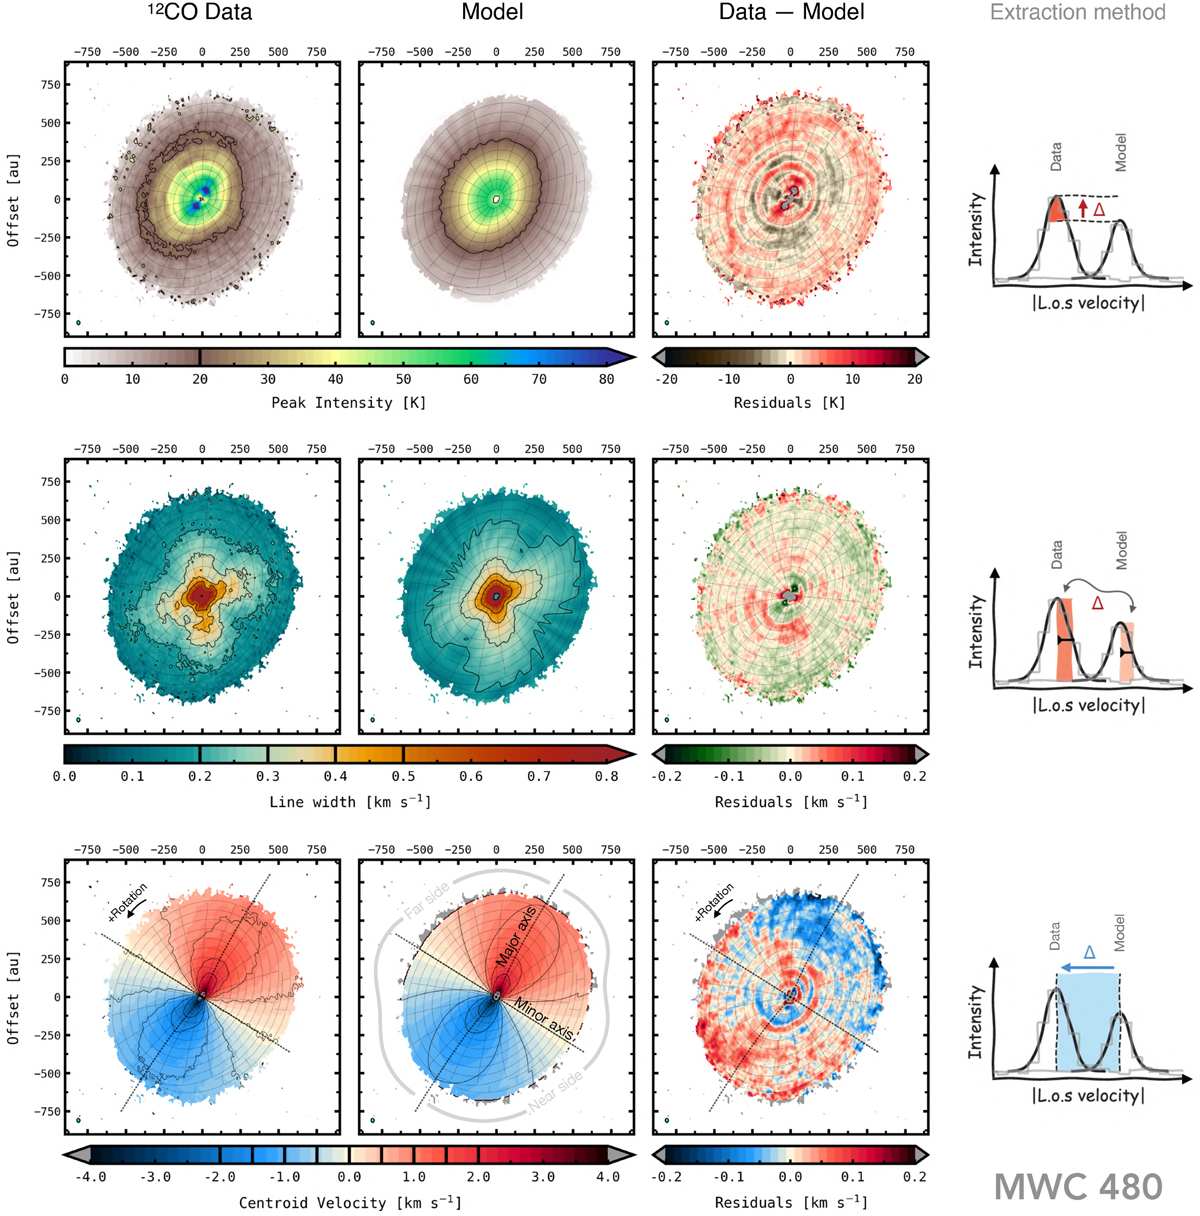
Extraction of the line profile observables considered in this work, using MWC 480 12CO data as example. Peak intensities (top), line widths (middle), and centroid velocities (bottom) are displayed for both data and best-fit model, as well as residual maps showing the difference between them. Sketches on the rightmost column illustrate how each line profile observable is computed on the data cube and subsequently compared to those derived on the smooth, Keplerian model cube obtained by DISCMINER. The black solid lines are reference contours to ease comparison. Their levels are indicated in the colour bars. Residuals on each of the observables are driven by temperature, density and velocity fluctuations in the gas disc.
Current usage metrics show cumulative count of Article Views (full-text article views including HTML views, PDF and ePub downloads, according to the available data) and Abstracts Views on Vision4Press platform.
Data correspond to usage on the plateform after 2015. The current usage metrics is available 48-96 hours after online publication and is updated daily on week days.
Initial download of the metrics may take a while.