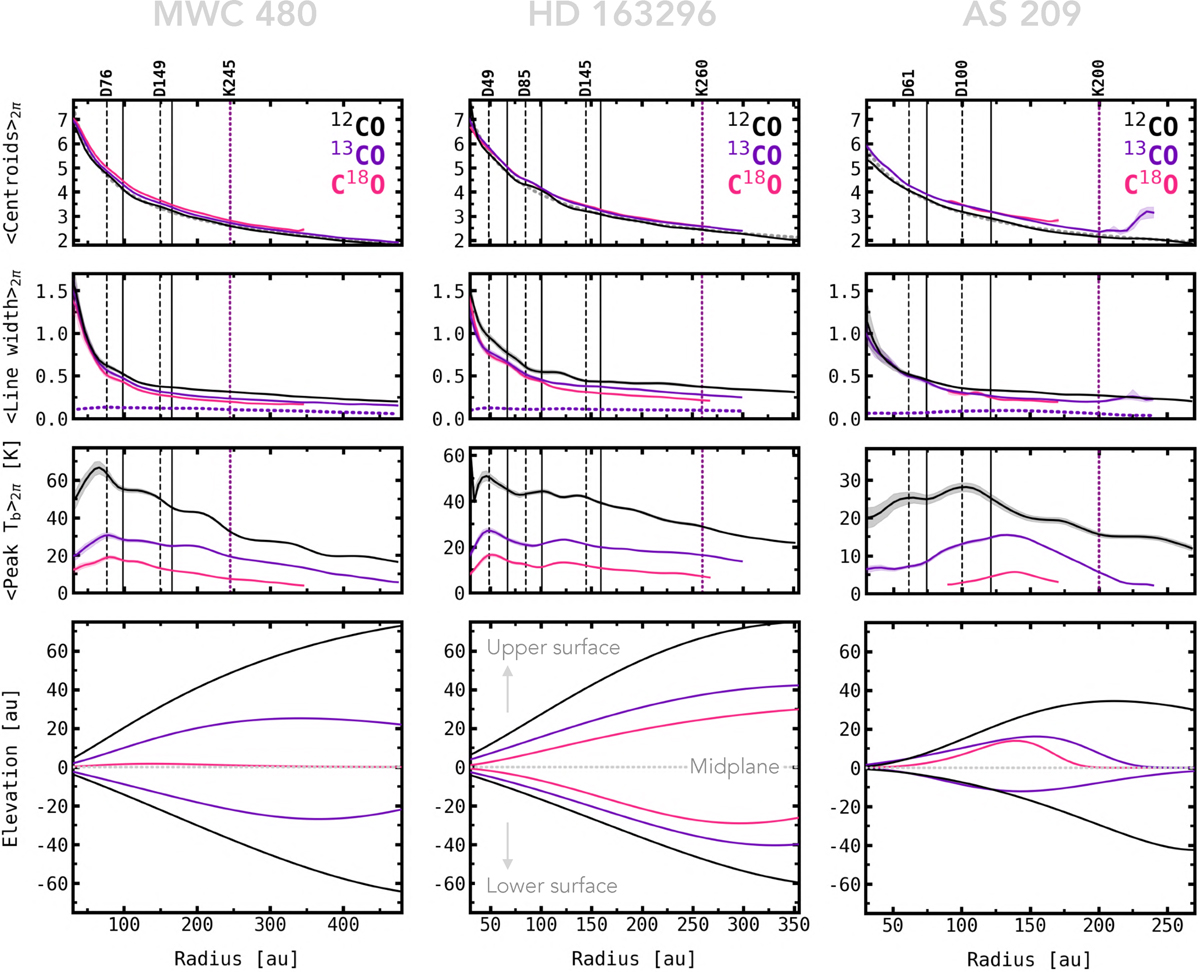
Fig. B.5
Download original image
Additional observables obtained from the DISCMINER analysis of the discs around MWC 480, HD 163296, AS 209, (IM Lup and GM Aur in next page) as traced by 12CO, 13CO, and C18O. Top row: Rotation curves computed from azimuthal averages of deprojected line-of-sight velocities. For reference, the grey dashed line in each panel is the Keplerian rotation curve of the best-fit model found for 12CO. Second row: Azimuthally averaged profiles of line widths, defined as the standard deviation of Gaussians fitted to the data line profiles. For reference, the purple dashed line in each panel represents the thermal broadening computed at the 13CO peak brightness temperature. Third row: Azimuthally averaged profiles of peak intensities converted to brightness temperatures using the Rayleigh-Jeans law. Bottom row: Elevation of upper and lower emission surfaces. Apart from intensity profiles, all panels in each row share the same x and y-axis extent. Vertical dashed, solid, and dotted lines mark the radial location of dust gaps, rings, and kinks observed in the channel maps of 12CO, respectively.
Current usage metrics show cumulative count of Article Views (full-text article views including HTML views, PDF and ePub downloads, according to the available data) and Abstracts Views on Vision4Press platform.
Data correspond to usage on the plateform after 2015. The current usage metrics is available 48-96 hours after online publication and is updated daily on week days.
Initial download of the metrics may take a while.