Fig. 15
Download original image
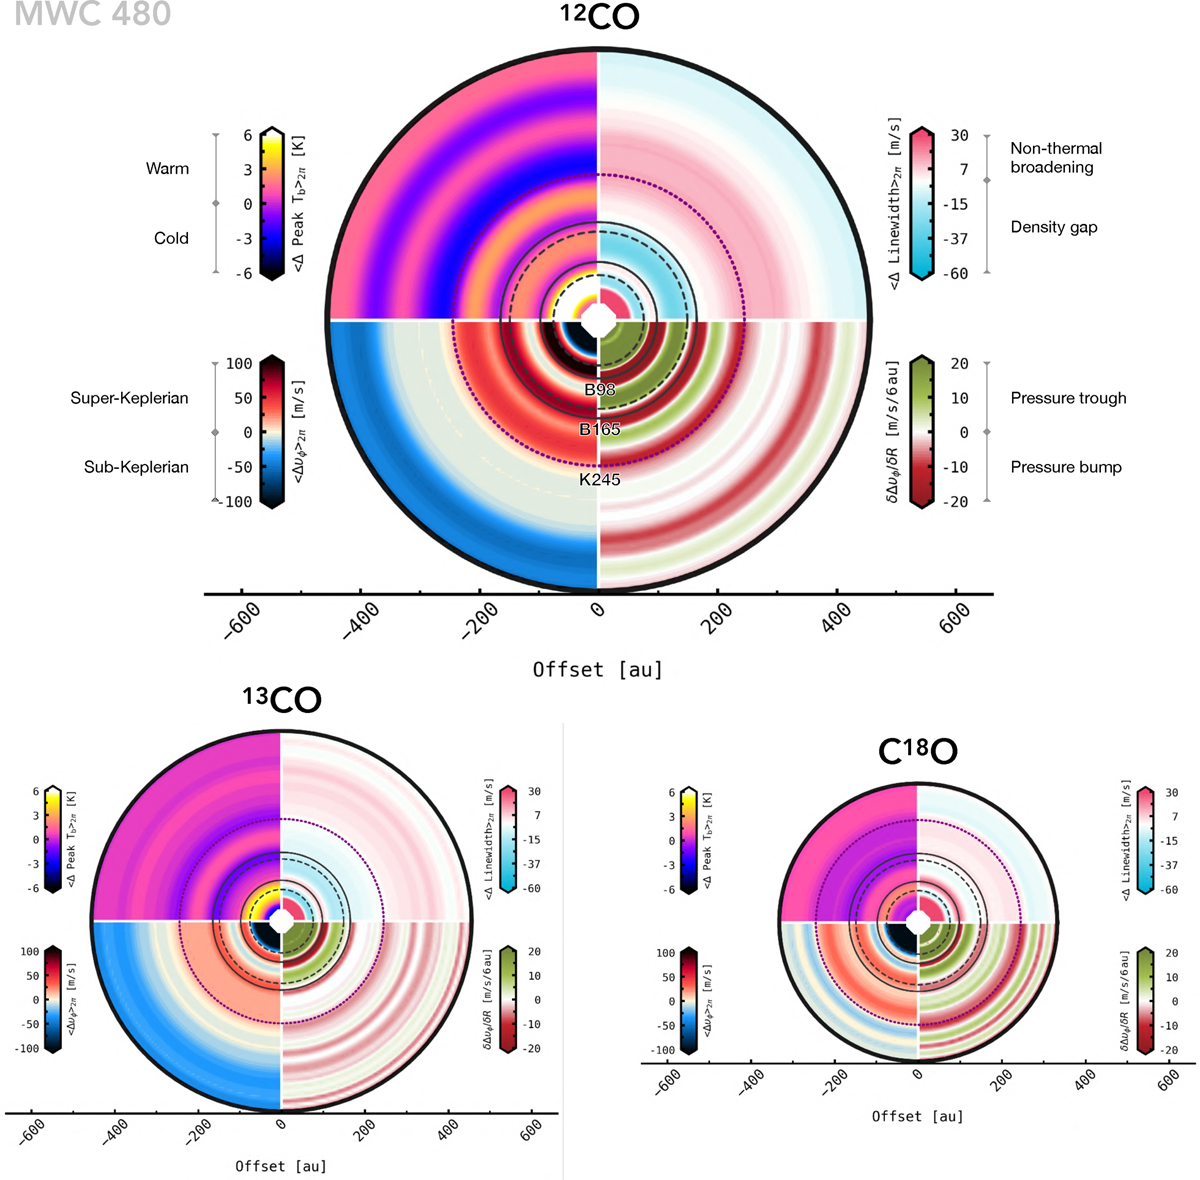
Summary of azimuthally averaged residuals extrapolated onto a 2D grid to aid visualisation of (anti-)correlations between the different line profile observables extracted from the disc of MWC 480. The radial location of dust gaps and rings is illustrated as dashed and solid lines, respectively. The radial distance of the most prominent kink apparent in 12CO channel maps is marked by the dotted purple line.
Current usage metrics show cumulative count of Article Views (full-text article views including HTML views, PDF and ePub downloads, according to the available data) and Abstracts Views on Vision4Press platform.
Data correspond to usage on the plateform after 2015. The current usage metrics is available 48-96 hours after online publication and is updated daily on week days.
Initial download of the metrics may take a while.