Fig. 9
Download original image
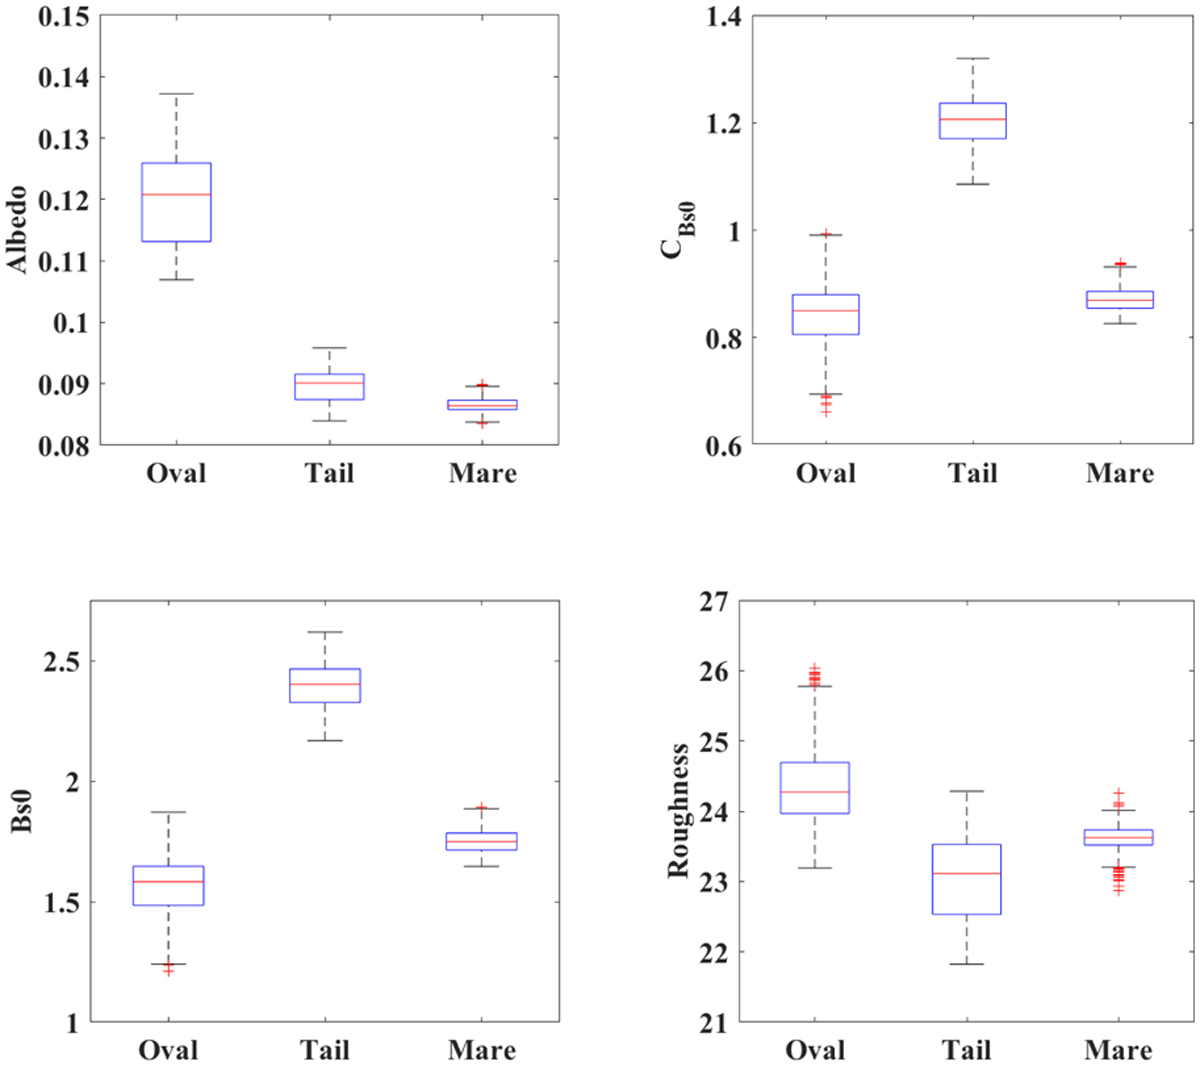
Box plot of the Hapke parameters extracted from central oval, the northern tail, and the mare region south of Reiner Gamma (area marked in Fig. 7) using the GC filter. The boxes and whiskers indicate the 50th and 95th percentiles in the distribution, respectively. Extreme outliers are shown with the plus symbol. The median value is shown by the horizontal line inside the box.
Current usage metrics show cumulative count of Article Views (full-text article views including HTML views, PDF and ePub downloads, according to the available data) and Abstracts Views on Vision4Press platform.
Data correspond to usage on the plateform after 2015. The current usage metrics is available 48-96 hours after online publication and is updated daily on week days.
Initial download of the metrics may take a while.