Fig. 7
Download original image
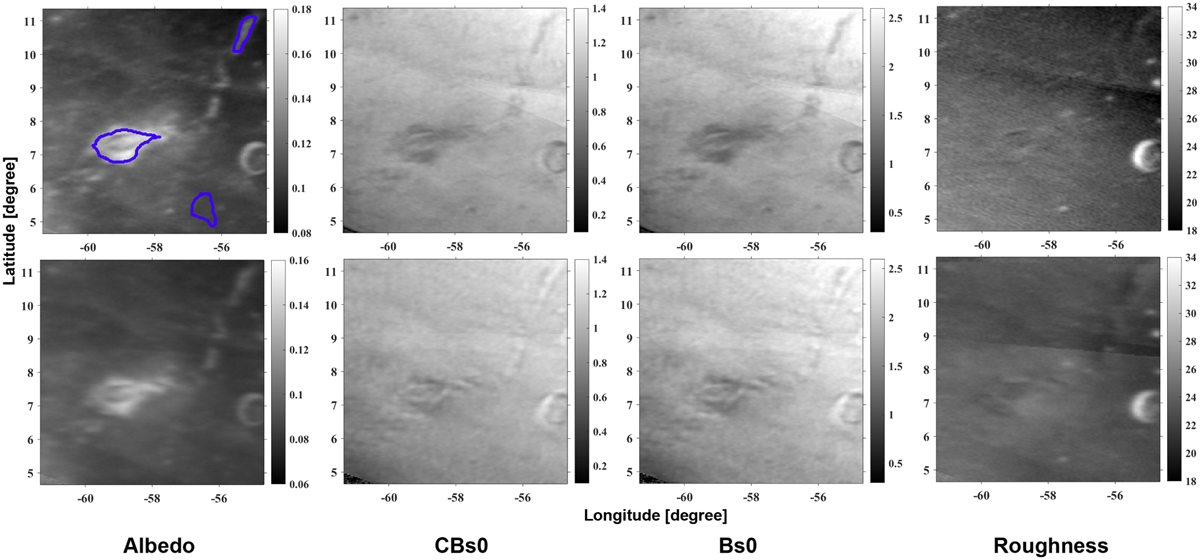
Derived Hapke parameter maps. The telescopic images were processed by sharpening to uniform sharpness. The top row shows the parameters for the RC filter, and the bottom row shows those for the GC filter. The Hapke parameters extracted from the regions marked in the RC albedo image are plotted in Figs. 8 and 9 for the RC and GC filters, respectively.
Current usage metrics show cumulative count of Article Views (full-text article views including HTML views, PDF and ePub downloads, according to the available data) and Abstracts Views on Vision4Press platform.
Data correspond to usage on the plateform after 2015. The current usage metrics is available 48-96 hours after online publication and is updated daily on week days.
Initial download of the metrics may take a while.