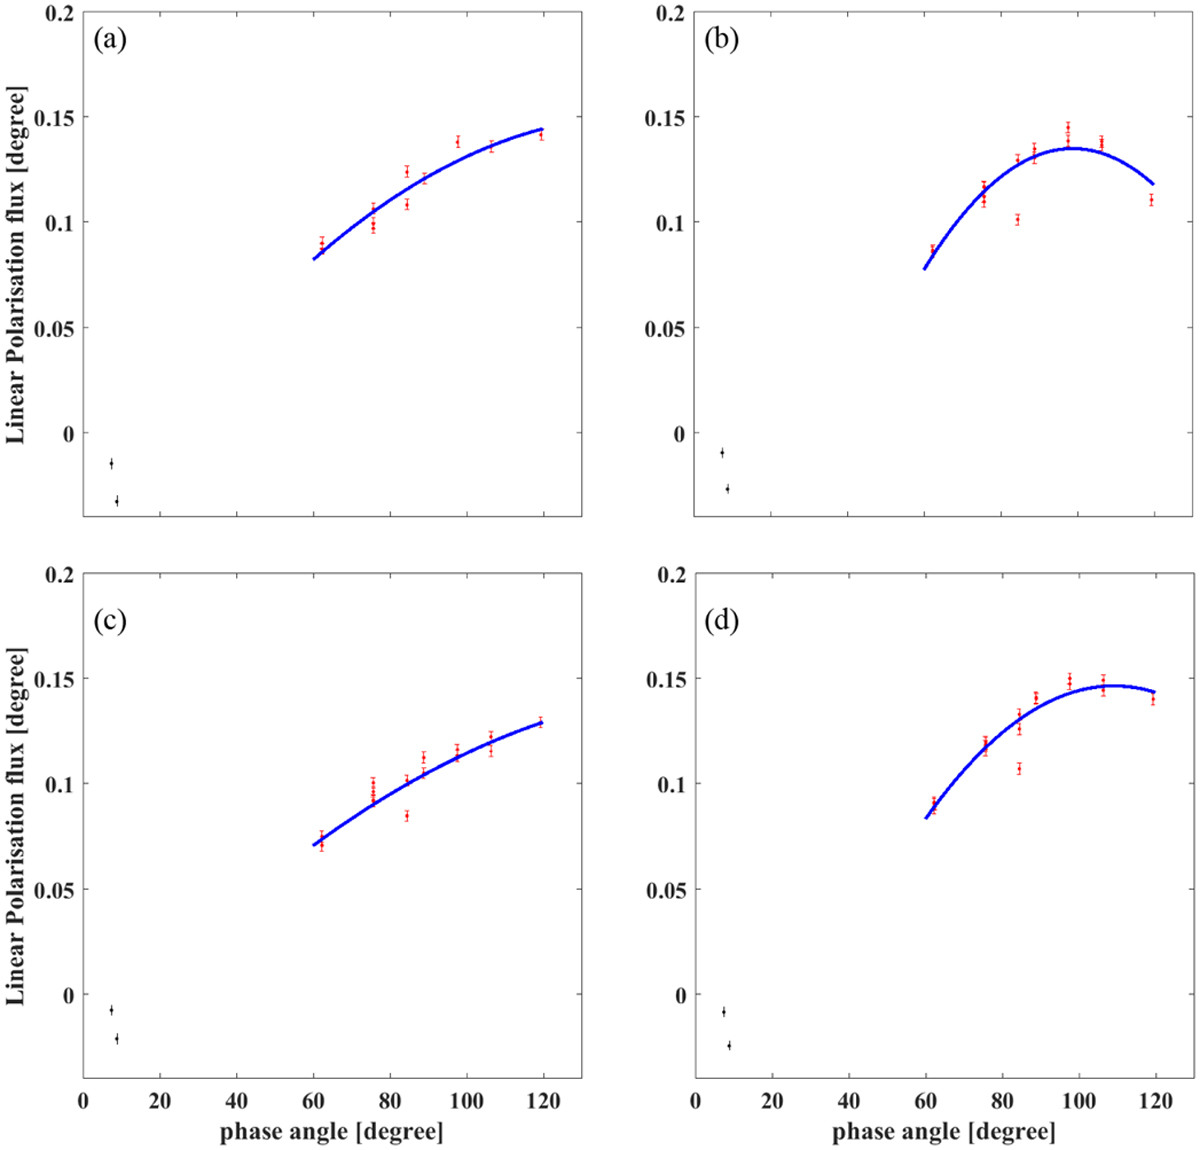
Fig. 10
Download original image
Polarimetric phase function in the GC domain for pixels extracted from (a) the northern tail, (b) the western part of the central oval, (c) the eastern part of the central oval, and (d) the off-swirl mare to the south. The dots represent the average value of P, and the solid lines are second-degree polynomial fits to the data points around the maximum polarization angle, excluding phase angles lower than 60°. The blue and red dots represent the observations in the negative and positive branch of the polarization, respectively. The error bars indicate the 1σ uncertainty of the polarization fraction, which is independent of the polarization fraction itself.
Current usage metrics show cumulative count of Article Views (full-text article views including HTML views, PDF and ePub downloads, according to the available data) and Abstracts Views on Vision4Press platform.
Data correspond to usage on the plateform after 2015. The current usage metrics is available 48-96 hours after online publication and is updated daily on week days.
Initial download of the metrics may take a while.