Fig. 4.
Download original image
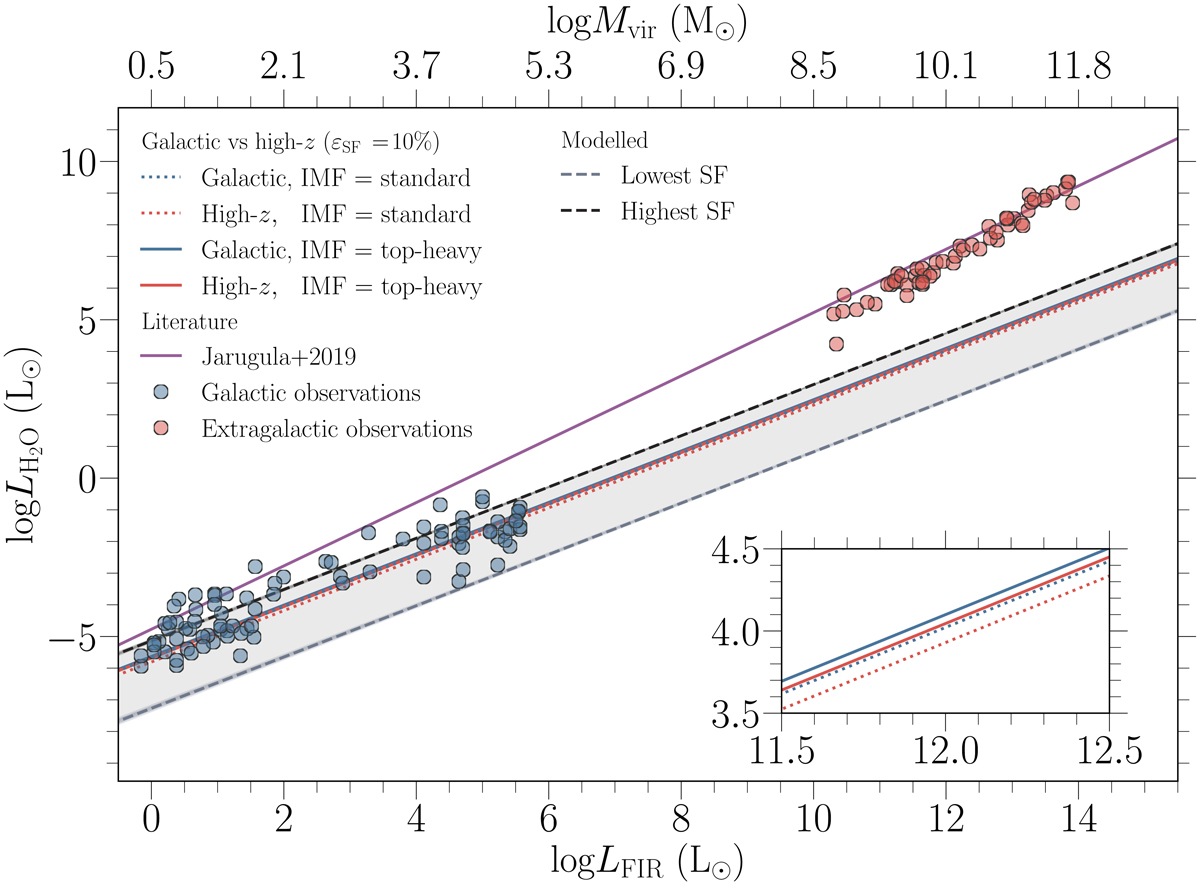
Simulated water-line luminosity as a function of LFIR. The dashed black line represents the most emitting galaxy in our simulations (εSF = 30%, IMF = top-heavy and ![]() ), while the dashed gray line corresponds to the least emitting one (εSF = 1%, IMF = bottom-heavy and
), while the dashed gray line corresponds to the least emitting one (εSF = 1%, IMF = bottom-heavy and ![]() ). The gray-shaded area between these two lines refers to the probed parameter space, and all possible outcomes considered in this study would fall in that regime. Solid blue and red lines refer to the results derived for setups with the top-heavy IMF form for the Galactic and extragalactic Menv − I relations, respectively. Dotted lines show the results for these two correlations, when the standard IMF is applied. In both, i.e., the standard and the top-heavy cases, the free-fall-time scaling factor is set to 1. Circles refer to observational samples (for more details we refer the reader to Sect. 3.1), while the purple line represents the expected relation from Jarugula et al. (2019).
). The gray-shaded area between these two lines refers to the probed parameter space, and all possible outcomes considered in this study would fall in that regime. Solid blue and red lines refer to the results derived for setups with the top-heavy IMF form for the Galactic and extragalactic Menv − I relations, respectively. Dotted lines show the results for these two correlations, when the standard IMF is applied. In both, i.e., the standard and the top-heavy cases, the free-fall-time scaling factor is set to 1. Circles refer to observational samples (for more details we refer the reader to Sect. 3.1), while the purple line represents the expected relation from Jarugula et al. (2019).
Current usage metrics show cumulative count of Article Views (full-text article views including HTML views, PDF and ePub downloads, according to the available data) and Abstracts Views on Vision4Press platform.
Data correspond to usage on the plateform after 2015. The current usage metrics is available 48-96 hours after online publication and is updated daily on week days.
Initial download of the metrics may take a while.