Fig. 3.
Download original image
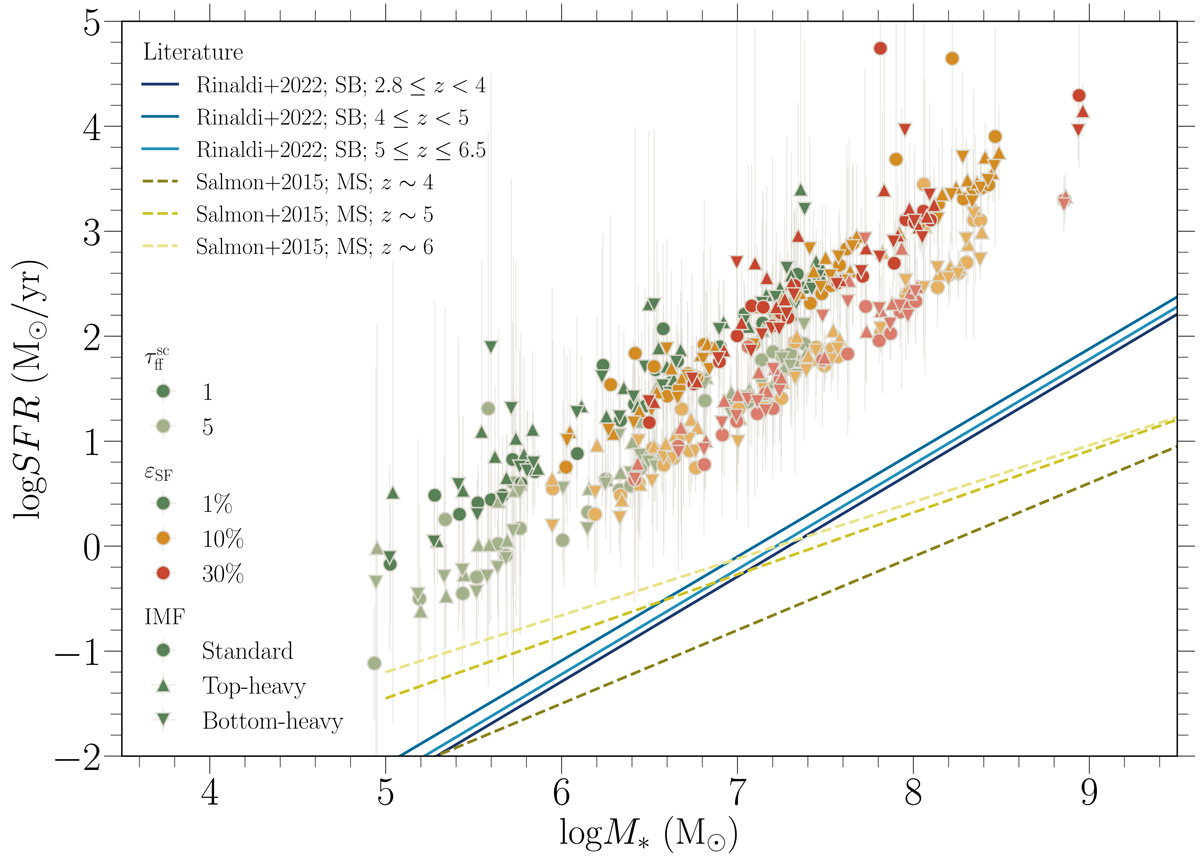
SFR as a function of stellar mass of each galaxy. Full color markers represent results, where the free-fall-time scaling factor was set to 1, while markers in the same but lighter colors correspond to ![]() of 5. Circles represent setups with the standard IMF (Chabrier 2003), while triangles pointing upwards and downwards represent setups with its top-heavy and bottom-heavy versions, respectively. Different colors of the markers refer to different star formation efficiencies, where green, orange, and red mean an εSF of 1%, 10%, and 30%, respectively. Solid lines represent best-fit lines from Rinaldi et al. (2022) to their starburst (SB) population, while dashed lines represent best fits to the main sequence galaxies from Salmon et al. (2015).
of 5. Circles represent setups with the standard IMF (Chabrier 2003), while triangles pointing upwards and downwards represent setups with its top-heavy and bottom-heavy versions, respectively. Different colors of the markers refer to different star formation efficiencies, where green, orange, and red mean an εSF of 1%, 10%, and 30%, respectively. Solid lines represent best-fit lines from Rinaldi et al. (2022) to their starburst (SB) population, while dashed lines represent best fits to the main sequence galaxies from Salmon et al. (2015).
Current usage metrics show cumulative count of Article Views (full-text article views including HTML views, PDF and ePub downloads, according to the available data) and Abstracts Views on Vision4Press platform.
Data correspond to usage on the plateform after 2015. The current usage metrics is available 48-96 hours after online publication and is updated daily on week days.
Initial download of the metrics may take a while.