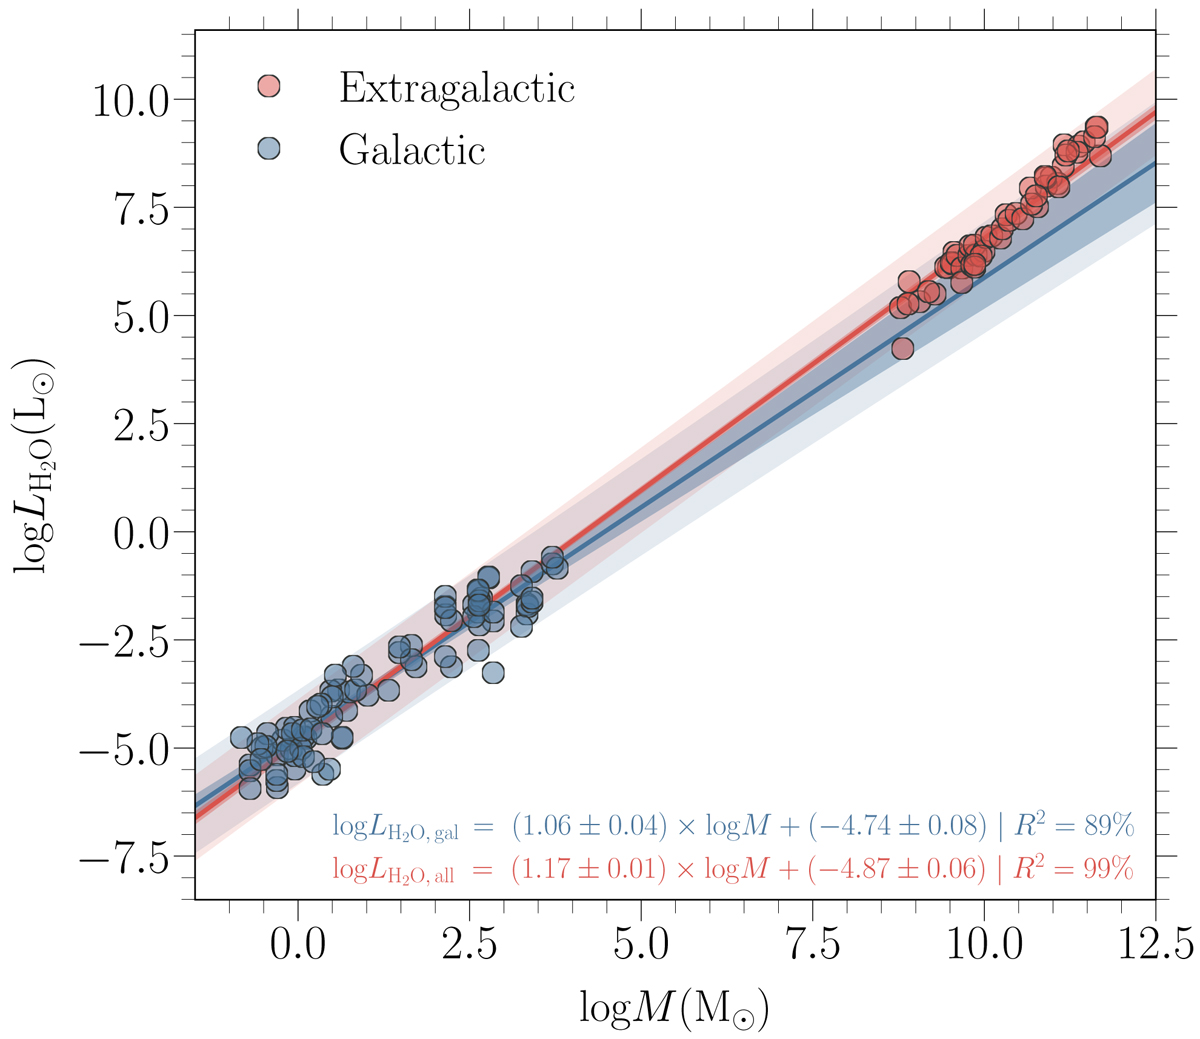
Fig. 2.
Download original image
Two types of correlations and observational samples used in this study. The blue solid line corresponds to the best fit to the Galactic with the data points taken from the Water Emission Database (Dutkowska & Kristensen 2022), while the red solid line represent the best fit that also includes the extragalactic sample consisting of nearby subLIRGs, LIRGs, and quasars, as well as high-z quasars, ULIRGs, and HyLIRGs (for details see Sect. 3.1). Markers correspond to the observations from each sample. Shading follows that from Fig. 1.
Current usage metrics show cumulative count of Article Views (full-text article views including HTML views, PDF and ePub downloads, according to the available data) and Abstracts Views on Vision4Press platform.
Data correspond to usage on the plateform after 2015. The current usage metrics is available 48-96 hours after online publication and is updated daily on week days.
Initial download of the metrics may take a while.