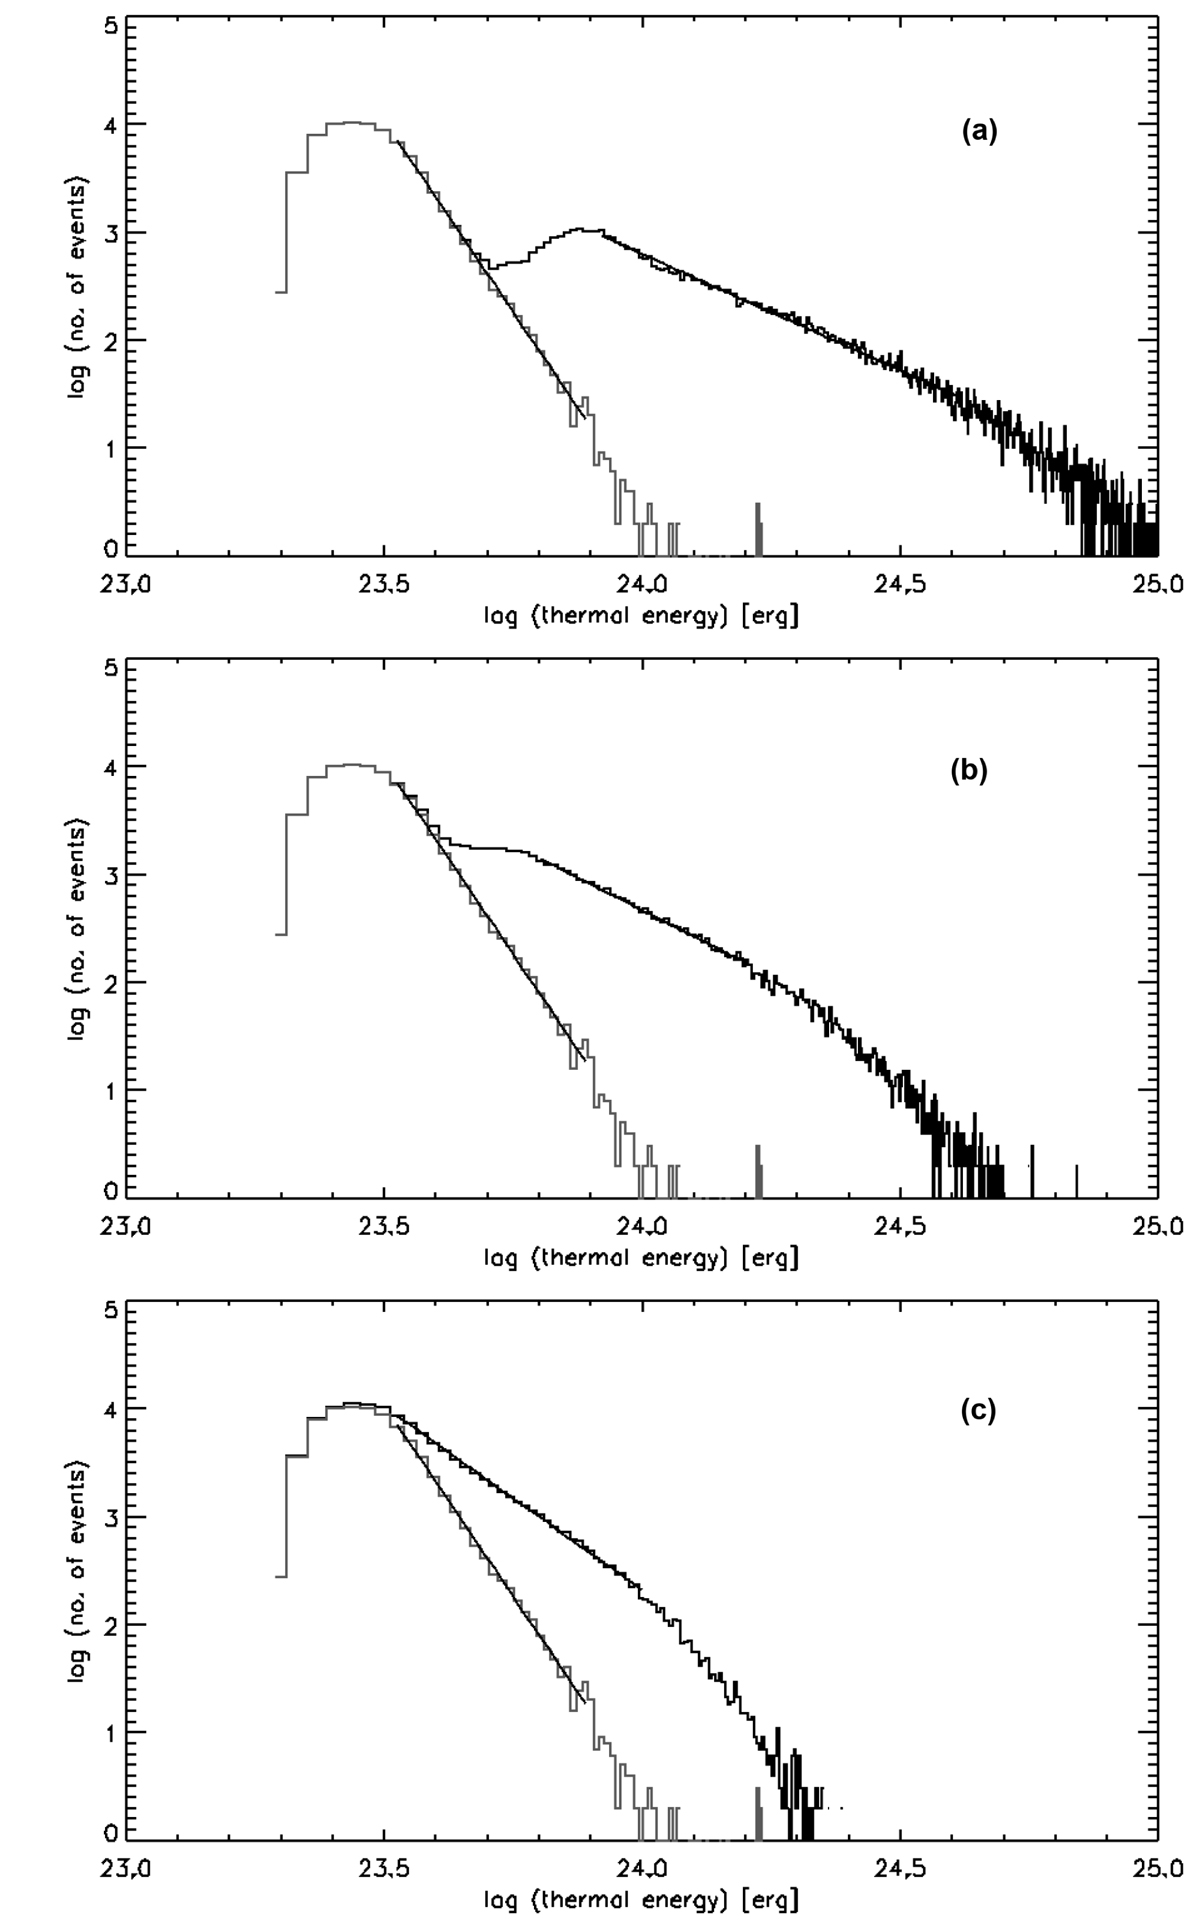
Fig. 7.
Download original image
Distribution of the event peak thermal energy for the SAS250W data set for a temperature of 220 000 K, assuming the depth D of the O V emission along the line of sight. (a) Equal to the event length along the slit (top panel). (b) Constant, equal to 3.36″ (middle panel). (c) Proportional to 1/length (bottom panel). The straight lines in all panels are power-law fits obtained separately for the population of one-pixel events (on the left) and the population of longer events with two or more pixels (on the right). The power index is given in Table 2. The energy along the X-axis is an upper limit derived with f = 1 (see Sects. 4.4 and 4.6 for a discussion).
Current usage metrics show cumulative count of Article Views (full-text article views including HTML views, PDF and ePub downloads, according to the available data) and Abstracts Views on Vision4Press platform.
Data correspond to usage on the plateform after 2015. The current usage metrics is available 48-96 hours after online publication and is updated daily on week days.
Initial download of the metrics may take a while.