Open Access
Fig. 3.
Download original image
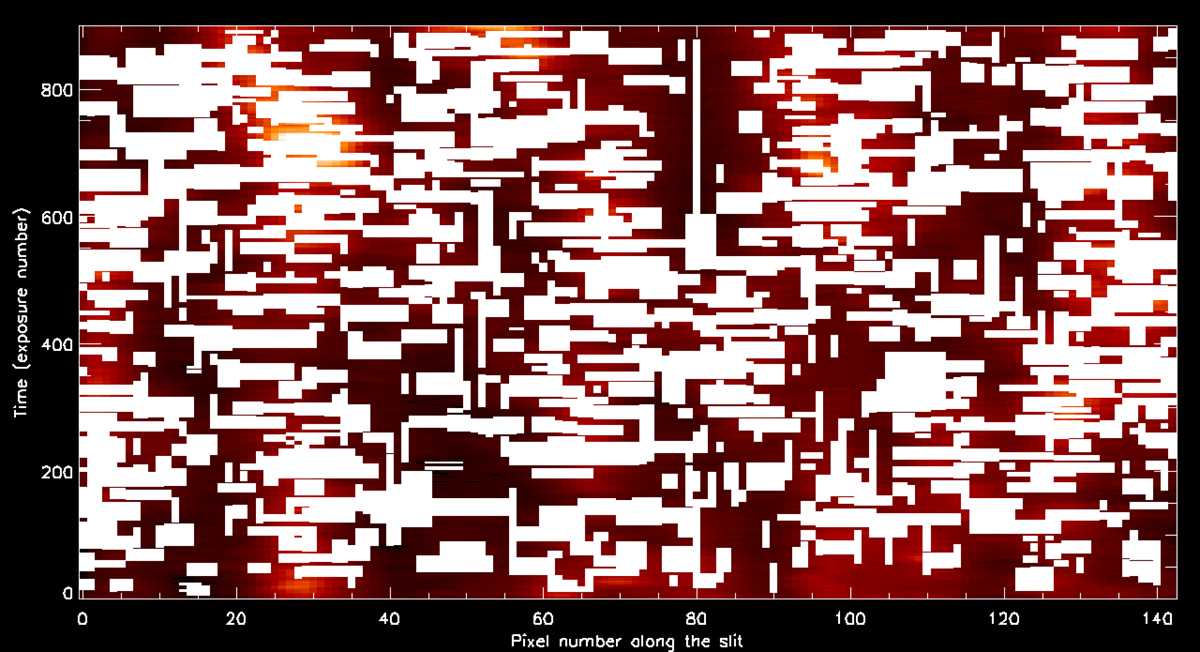
Events detected in the time series from Fig. 1. The size of each box in the Y direction is from the event start time to the event end time. The size of each box in the X direction includes all pixels grouped as one event. See text for details.
Current usage metrics show cumulative count of Article Views (full-text article views including HTML views, PDF and ePub downloads, according to the available data) and Abstracts Views on Vision4Press platform.
Data correspond to usage on the plateform after 2015. The current usage metrics is available 48-96 hours after online publication and is updated daily on week days.
Initial download of the metrics may take a while.