Open Access
Fig. 2.
Download original image
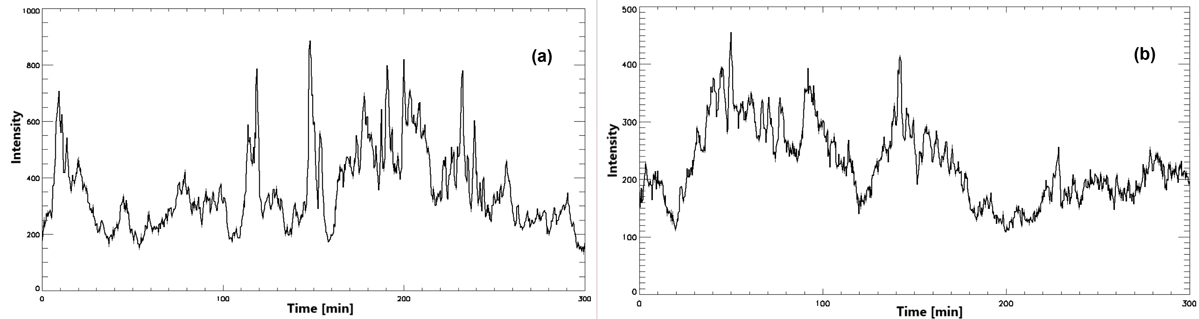
Example light curves (i.e. intensity in units of [counts per exposure]) of the time series from Fig. 1. (a) Left panel: in pixel 70. (b) Right panel: in pixel 120. The intensity scale in panel (b) is half of the scale in panel (a). Each peak in these light curves constitutes an event.
Current usage metrics show cumulative count of Article Views (full-text article views including HTML views, PDF and ePub downloads, according to the available data) and Abstracts Views on Vision4Press platform.
Data correspond to usage on the plateform after 2015. The current usage metrics is available 48-96 hours after online publication and is updated daily on week days.
Initial download of the metrics may take a while.