Fig. 7.
Download original image
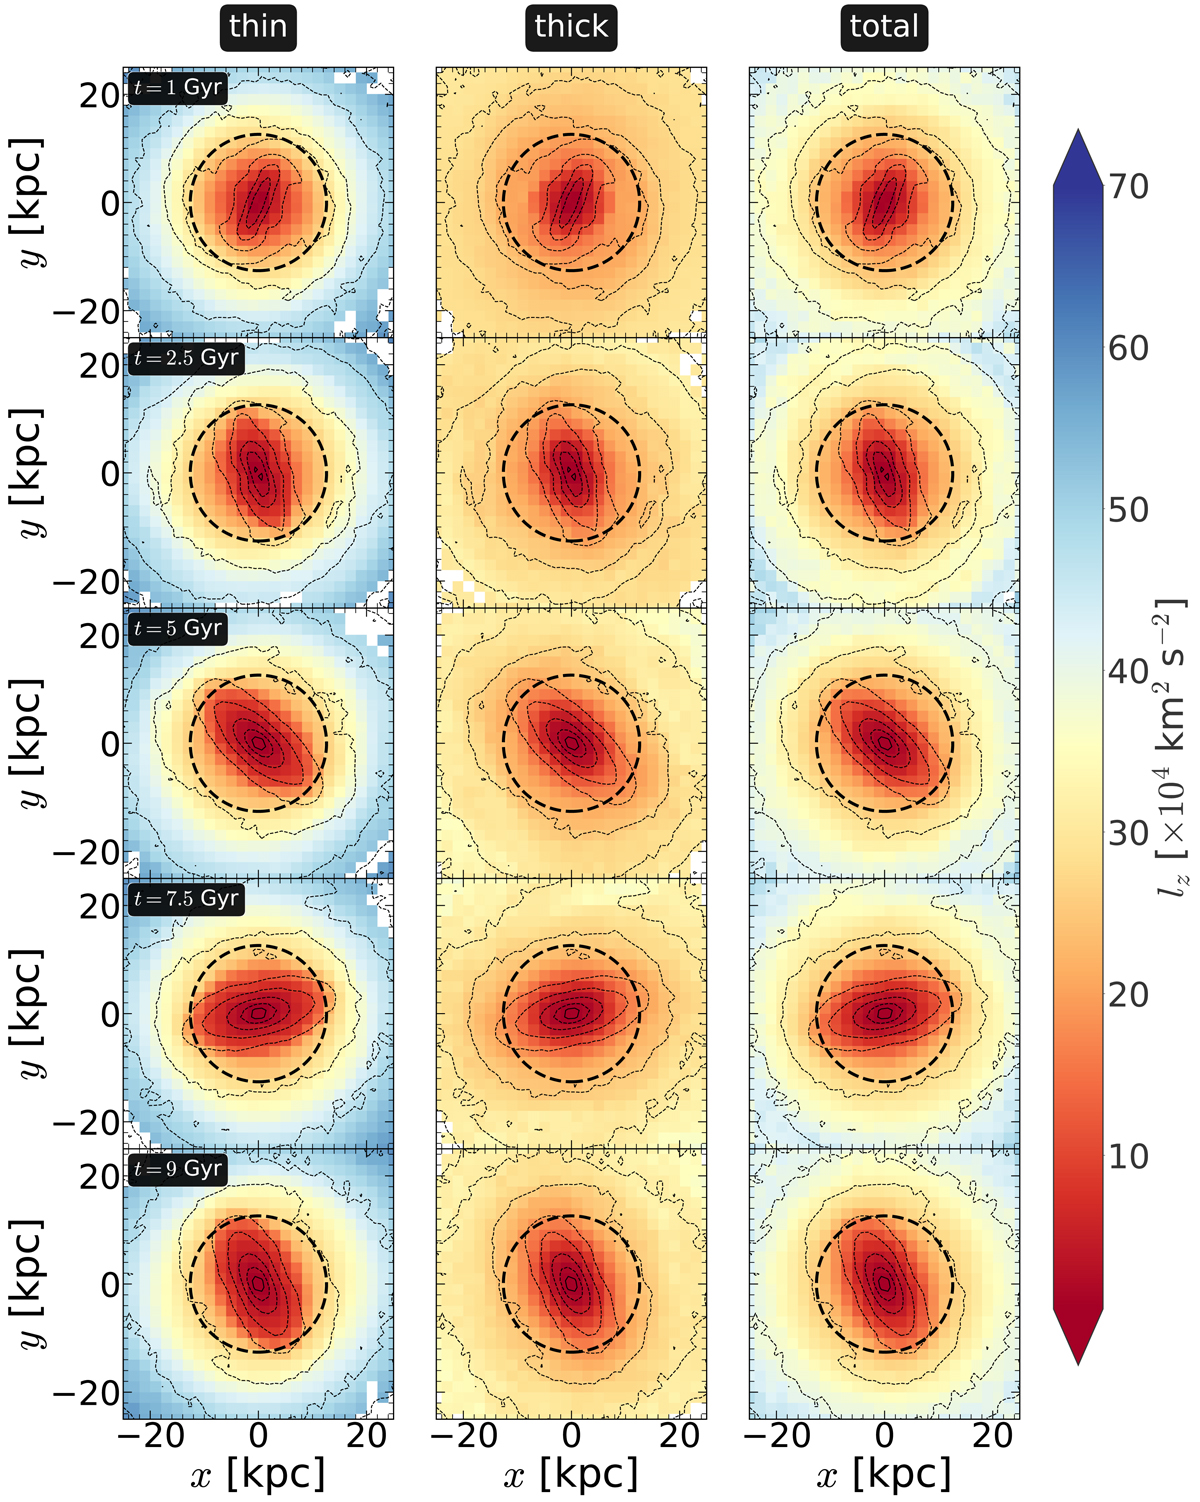
Distribution of the z-component of the specific angular momentum in the face-on projection ((x, y)-plane) at different times for the thin- (left panels), thick- (middle panels), and thin+thick disc particles (right panels) for the model rthickE0.5. The dotted lines denote the contours of the total (thin+thick) surface density. The dashed black circle in each sub-panel denotes the extent of the bar.
Current usage metrics show cumulative count of Article Views (full-text article views including HTML views, PDF and ePub downloads, according to the available data) and Abstracts Views on Vision4Press platform.
Data correspond to usage on the plateform after 2015. The current usage metrics is available 48-96 hours after online publication and is updated daily on week days.
Initial download of the metrics may take a while.