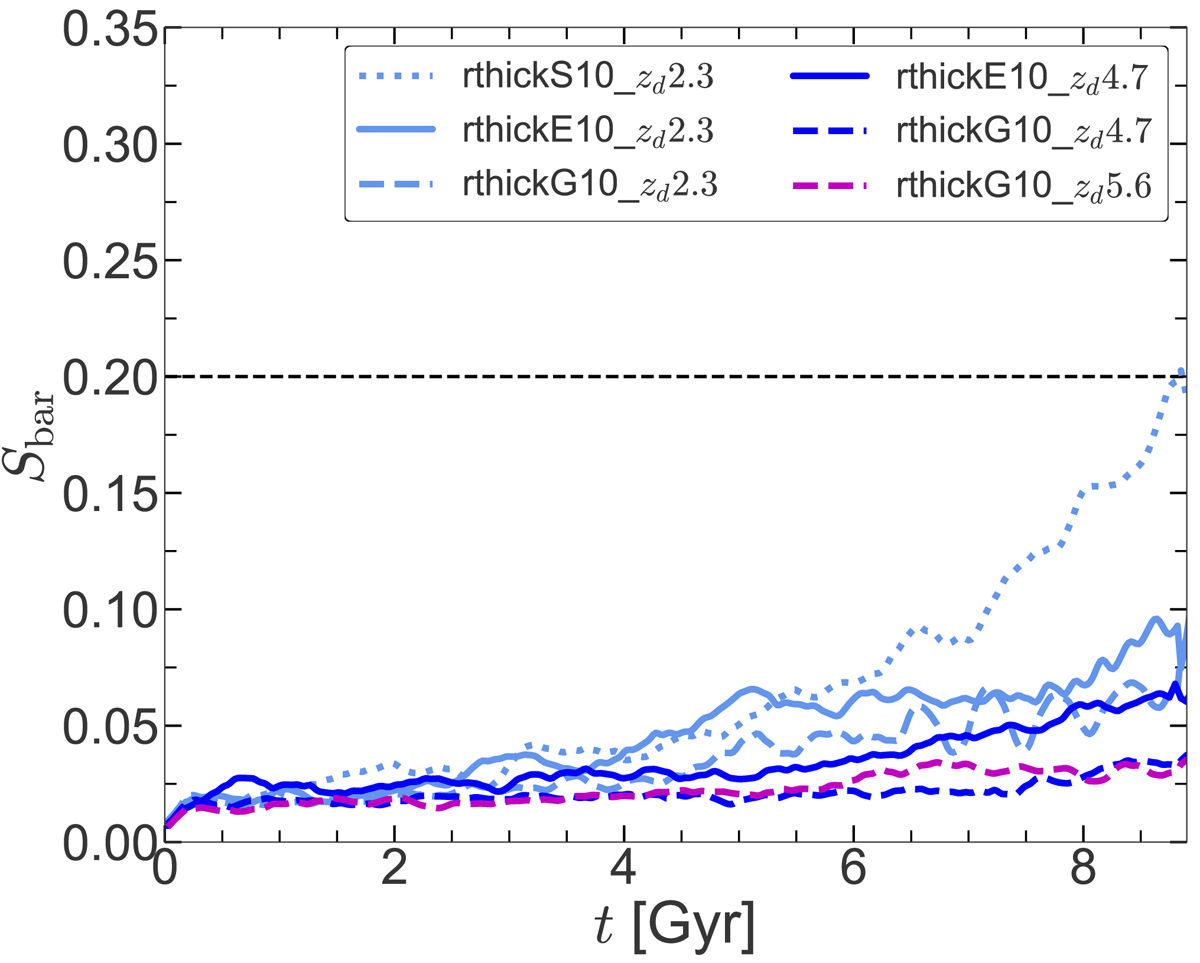
Fig. 5.
Download original image
Temporal evolution of the bar strength Sbar for the six thick-disc-only models with a varying vertical scale height. For details, see the text. The solid line denotes the rthickE models, the dashed line denotes the rthickG models, and the dotted line denotes the rthickS models. Different line colours denote models with different scale-height values. With increasing vertical scale height, the models progressively become bar stable. The horizontal line denotes Sbar = 0.2 and is used as a (operational) limit for the onset of bar formation.
Current usage metrics show cumulative count of Article Views (full-text article views including HTML views, PDF and ePub downloads, according to the available data) and Abstracts Views on Vision4Press platform.
Data correspond to usage on the plateform after 2015. The current usage metrics is available 48-96 hours after online publication and is updated daily on week days.
Initial download of the metrics may take a while.