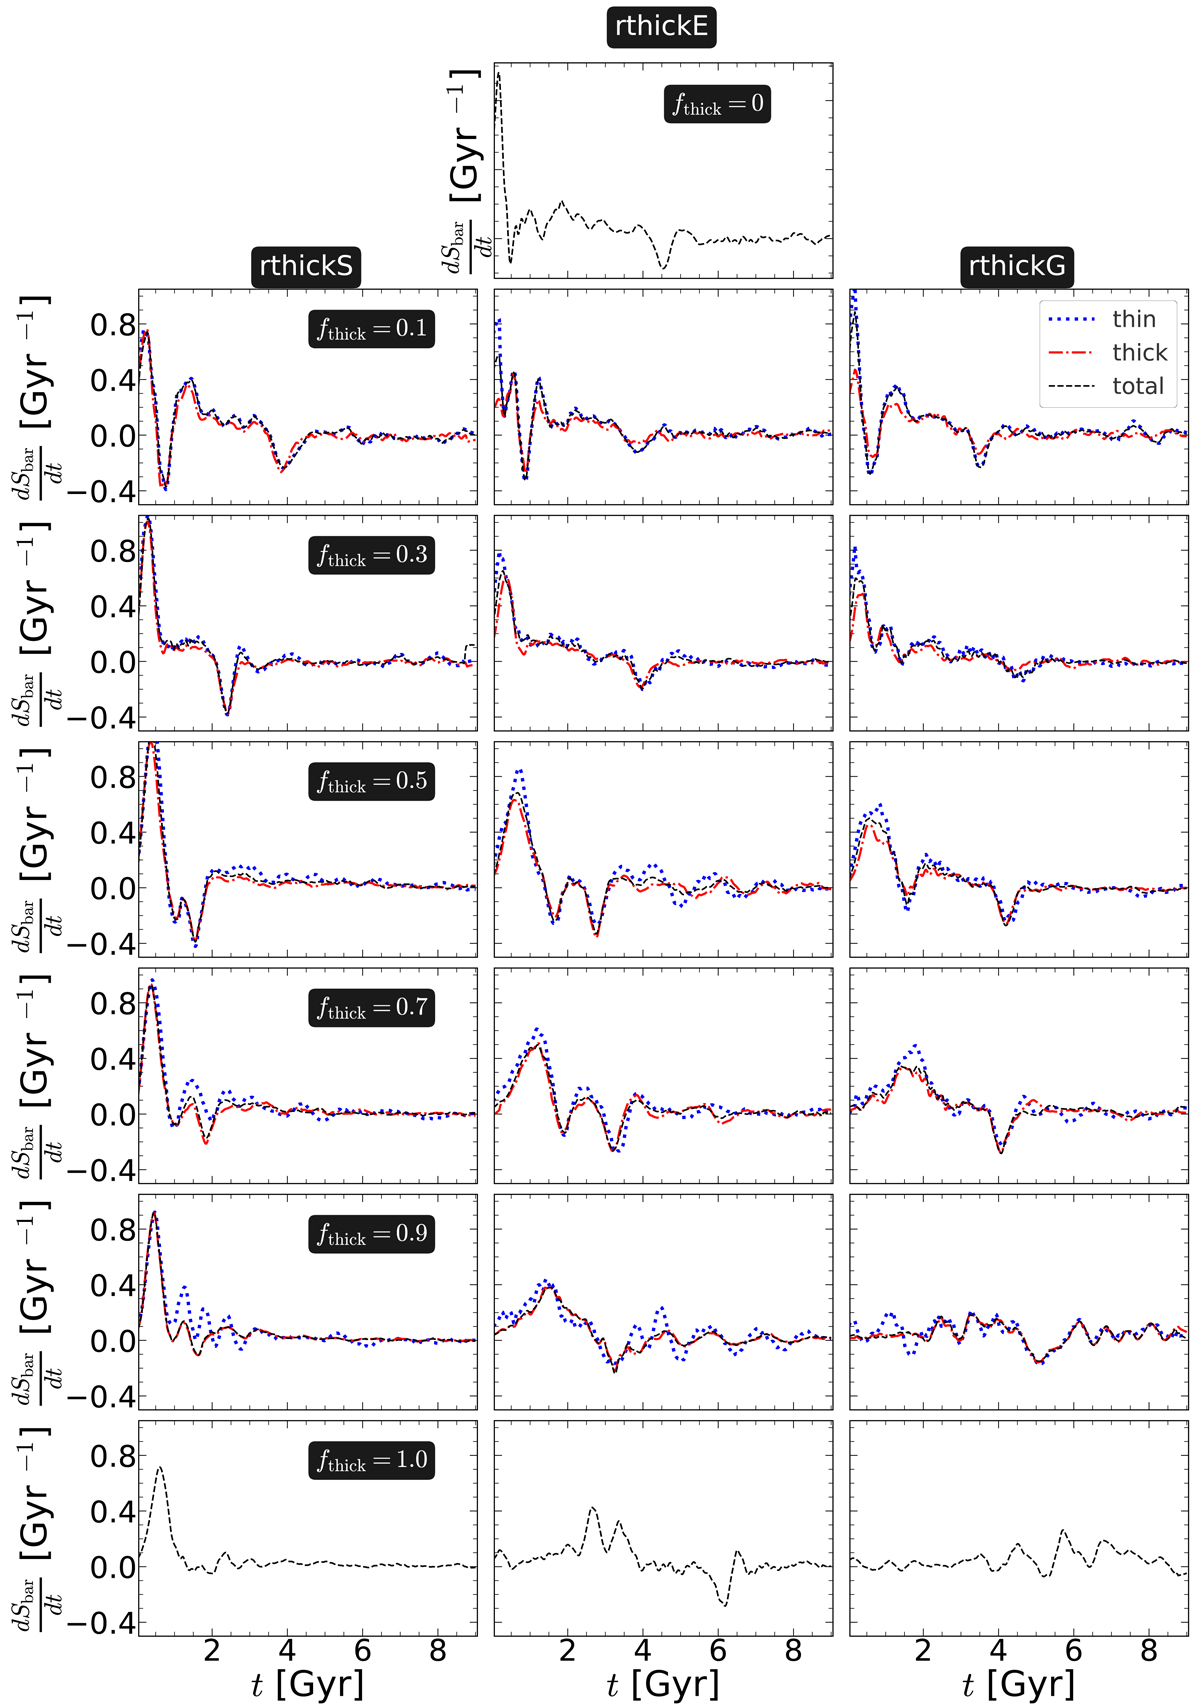
Fig. 4.
Download original image
Temporal evolution of the growth/decay rate of the bar strength (dSbar/dt), for the thin-, thick-, and total (thin+thick) disc components for all models with varying fthick values. Left panels: evolution for the rthickS models, and the middle and right panels: evolution for the rthickE and rthickG models, respectively. The fthick values are indicated in the left-most panel of each row. Top middle row: growth/decay rate of the bar strength for the thin-disc-only model (fthick = 0).
Current usage metrics show cumulative count of Article Views (full-text article views including HTML views, PDF and ePub downloads, according to the available data) and Abstracts Views on Vision4Press platform.
Data correspond to usage on the plateform after 2015. The current usage metrics is available 48-96 hours after online publication and is updated daily on week days.
Initial download of the metrics may take a while.