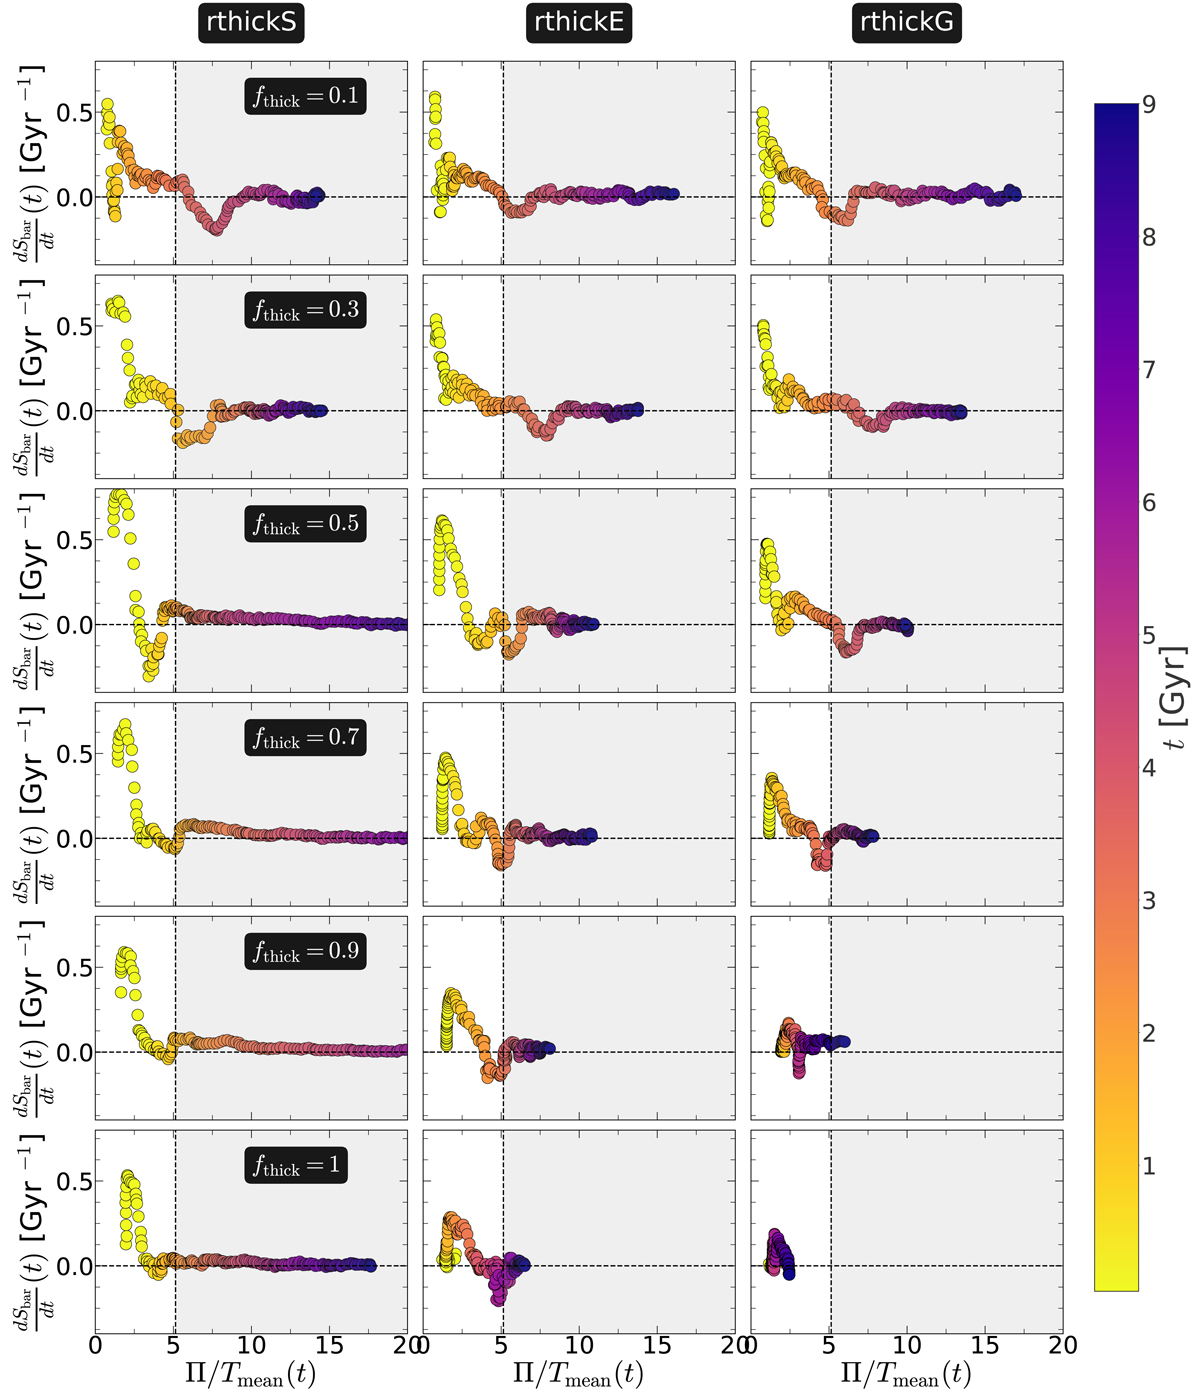
Fig. 12.
Download original image
Evolution of the ratio of the total mean kinetic energy to total random kinetic energy, calculated within the extent of the bar, (Π/Tmean(t; R < Rbar)), for the total (thin+thick) disc particles, plotted against the growth rate of the bar (dSbar/dt) for all thin+thick models with varying fthick values. Left panels: evolution for the rthickS models, and the middle and right panels: evolution for models rthickE and rthickG, respectively. The thick-disc fraction (fthick) varies from 0.1 to 1 (top to bottom), as indicated in the left-most panel of each row. The points are colour-coded by the simulation time (see the colour bar). The vertical black line denotes Π/Tmean = 5.14, which serves as a boundary for the bar instability phase, and the grey shaded region (in each sub-panel) denotes the bar-stable phase according to the OP criterion. For details, see the text.
Current usage metrics show cumulative count of Article Views (full-text article views including HTML views, PDF and ePub downloads, according to the available data) and Abstracts Views on Vision4Press platform.
Data correspond to usage on the plateform after 2015. The current usage metrics is available 48-96 hours after online publication and is updated daily on week days.
Initial download of the metrics may take a while.