Fig. 1.
Download original image
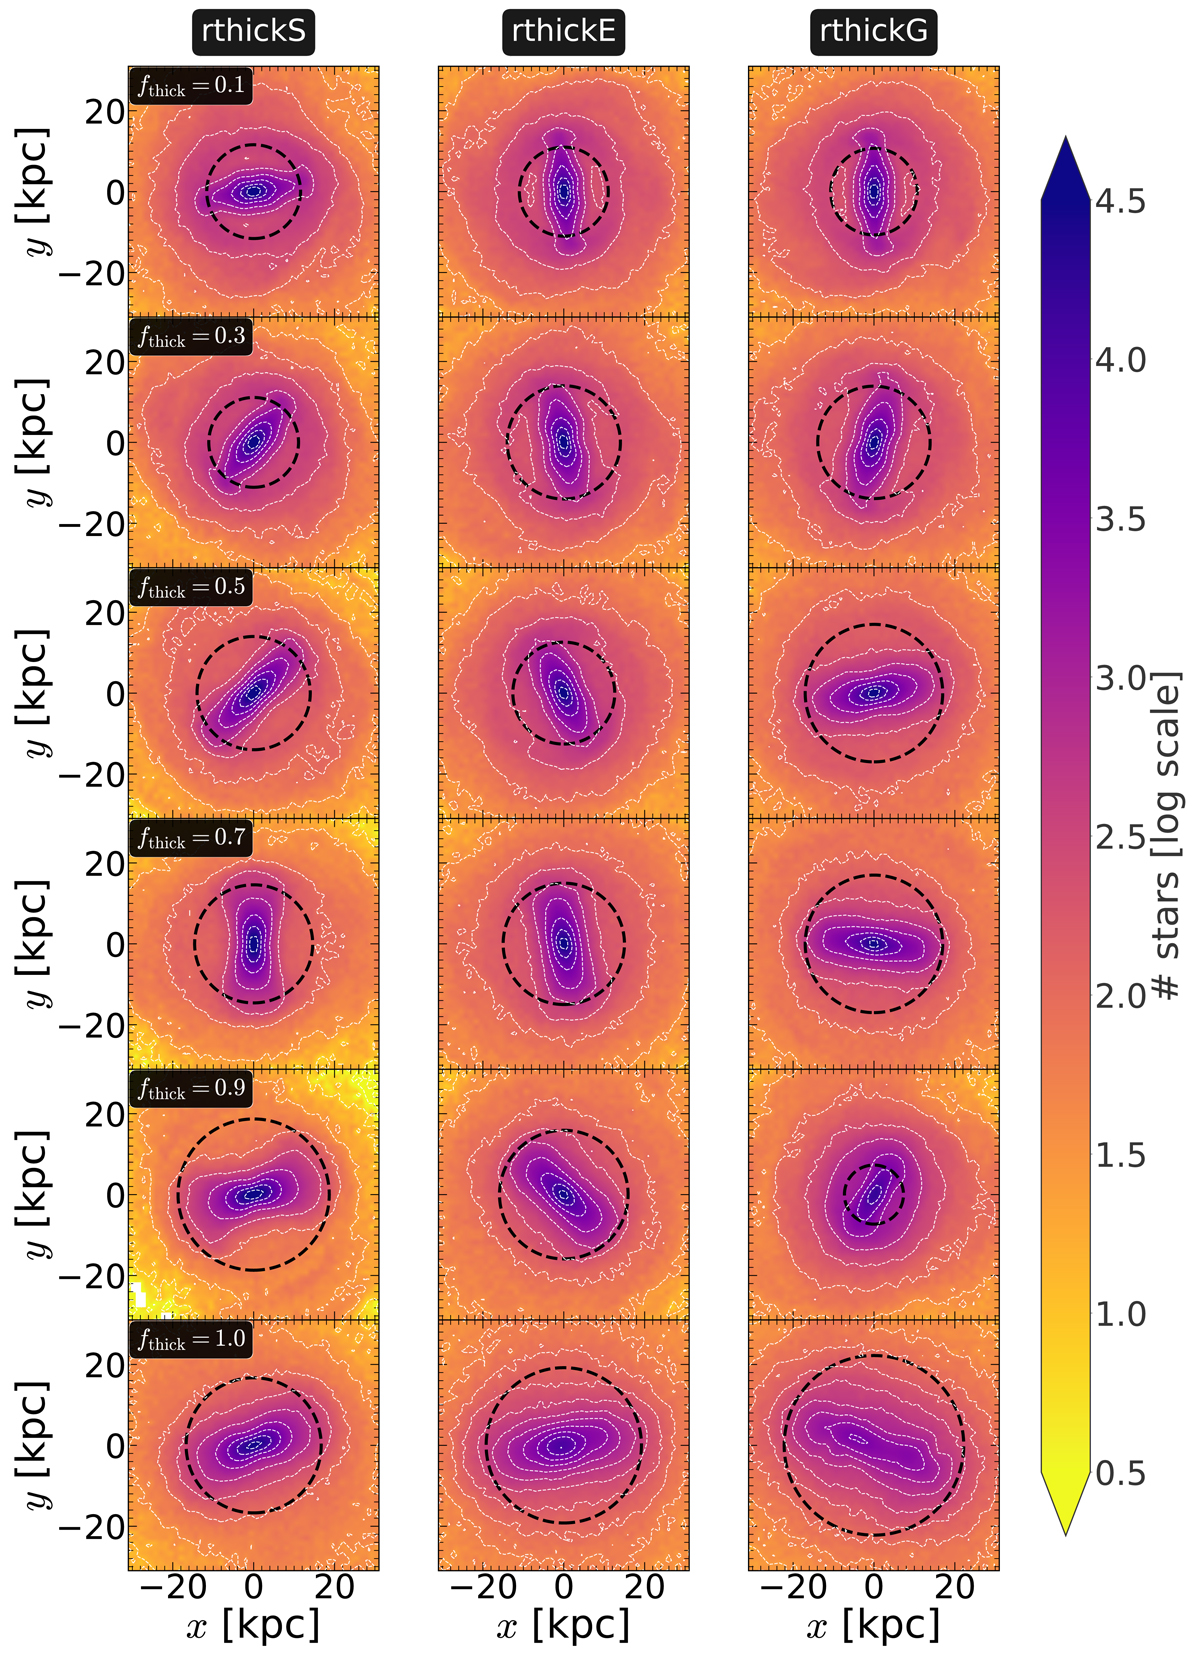
Face-on density distribution of all disc particles (thin+thick) at the end of the simulation run (t = 9 Gyr) for all thin+thick disc models with varying fthick values. The white solid lines denote the constant density contours. The solid black circle in each sub-panel denotes the corresponding extent of the bar (Rbar). Left panels: density distribution for the rthickS models, and the middle and right panels: density distribution for the rthickE and rthickG models, respectively. The thick disc fraction (fthick) varies from 0.1 to 1 (top to bottom), as indicated in the left-most panel of each row. A prominent bar forms in almost all models considered here.
Current usage metrics show cumulative count of Article Views (full-text article views including HTML views, PDF and ePub downloads, according to the available data) and Abstracts Views on Vision4Press platform.
Data correspond to usage on the plateform after 2015. The current usage metrics is available 48-96 hours after online publication and is updated daily on week days.
Initial download of the metrics may take a while.