Fig. 8

Download original image
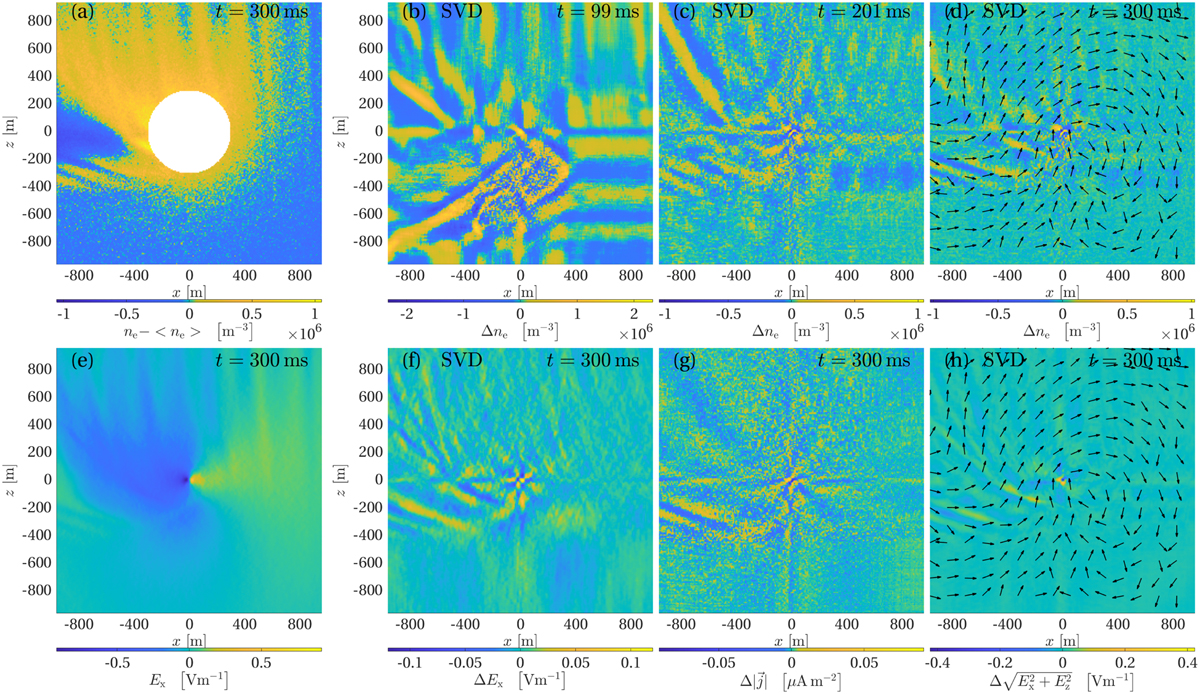
Wave structures in simulation run C. (a) Plasma density variation, ne− < ne >, in the x–z plane for t = 300 ms. The subtracted mean, < ne > is formed over the region shown. The circle in the centre has been removed as the high density in that region would otherwise dominate the mean. (b) Singular value decomposition (SVD) of the plasma density at t = 100 ms with the first four principal images removed. (c) SVD of the plasma density at t = 200 ms. (d) SVD of the plasma density at t = 300 ms. (e) The Ex component of the electric field at t = 300 ms. (f) SVD of the Ex component of the electric field at t = 300 ms. (g) SVD of the current density magnitude |j| at t = 300 ms. (h) SVD of the magnitude of the in-plane electric field, ![]() , at t = 300 ms. The black arrows in panels d and h show the direction of the current density.
, at t = 300 ms. The black arrows in panels d and h show the direction of the current density.
Current usage metrics show cumulative count of Article Views (full-text article views including HTML views, PDF and ePub downloads, according to the available data) and Abstracts Views on Vision4Press platform.
Data correspond to usage on the plateform after 2015. The current usage metrics is available 48-96 hours after online publication and is updated daily on week days.
Initial download of the metrics may take a while.


