Fig. 8
Download original image
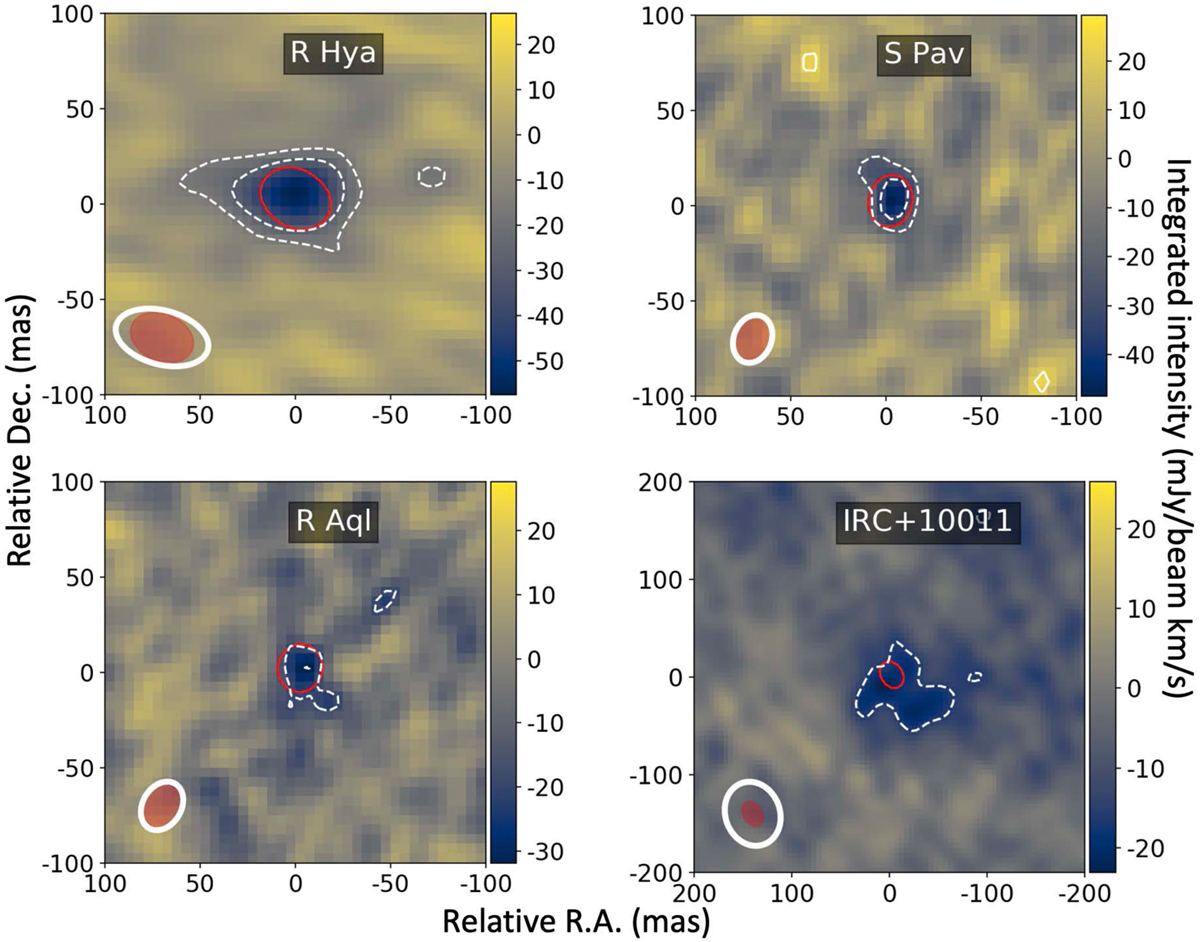
Zeroth moment absorption maps of the (1,1,0)–(0,1,1) ![]() transition of para H2O at 244.330 GHz in R Hya, S Pav, R Aql and IRC+10011. The extended configuration was used in R Hya, S Pav and R Aql while in IRC+10011 the combined extended and mid arrays were used. The map field of view is 100 × 100 mas except for IRC+10011 where it is 200 × 200 mas. The dotted white lines delineate the −3 and −5σ absorption contours. The red contour at (0,0) position delineate) the extent at half intensity of the continuum emission. The noise level is 5.4, 6.9, 5.2 and 6.3 mJy/beam km s−1 for R Hya, S Pav, IRC+10011 and R Aql, respectively. The HPBW line beam (white ellipse) is (50 × 28) mas at PA 75° in R Hya (26 × 20) mas at PA −20° in S Pav, (27 × 20) mas a PA −30° in R Aql and (59 × 50) mas at PA 12° in IRC+10011. The continuum beam (red ellipse) is (34 × 25) mas at PA = 67° in R Hya, (25 × 20) mas at PA −13° in SI Pav, (24 × 22) mas at PA −13° in R Aql and (55 × 44) mas at PA 34° in IRC+10011. (The velocity intervals are −19.0. to 4.9, −19.7 to 4.3, 15.3 to 21.2 and 35.3 to 64.1km s−1 for R Hya, S Pav, IRC+10011 and R Aql, respectively.)
transition of para H2O at 244.330 GHz in R Hya, S Pav, R Aql and IRC+10011. The extended configuration was used in R Hya, S Pav and R Aql while in IRC+10011 the combined extended and mid arrays were used. The map field of view is 100 × 100 mas except for IRC+10011 where it is 200 × 200 mas. The dotted white lines delineate the −3 and −5σ absorption contours. The red contour at (0,0) position delineate) the extent at half intensity of the continuum emission. The noise level is 5.4, 6.9, 5.2 and 6.3 mJy/beam km s−1 for R Hya, S Pav, IRC+10011 and R Aql, respectively. The HPBW line beam (white ellipse) is (50 × 28) mas at PA 75° in R Hya (26 × 20) mas at PA −20° in S Pav, (27 × 20) mas a PA −30° in R Aql and (59 × 50) mas at PA 12° in IRC+10011. The continuum beam (red ellipse) is (34 × 25) mas at PA = 67° in R Hya, (25 × 20) mas at PA −13° in SI Pav, (24 × 22) mas at PA −13° in R Aql and (55 × 44) mas at PA 34° in IRC+10011. (The velocity intervals are −19.0. to 4.9, −19.7 to 4.3, 15.3 to 21.2 and 35.3 to 64.1km s−1 for R Hya, S Pav, IRC+10011 and R Aql, respectively.)
Current usage metrics show cumulative count of Article Views (full-text article views including HTML views, PDF and ePub downloads, according to the available data) and Abstracts Views on Vision4Press platform.
Data correspond to usage on the plateform after 2015. The current usage metrics is available 48-96 hours after online publication and is updated daily on week days.
Initial download of the metrics may take a while.