Fig. 7
Download original image
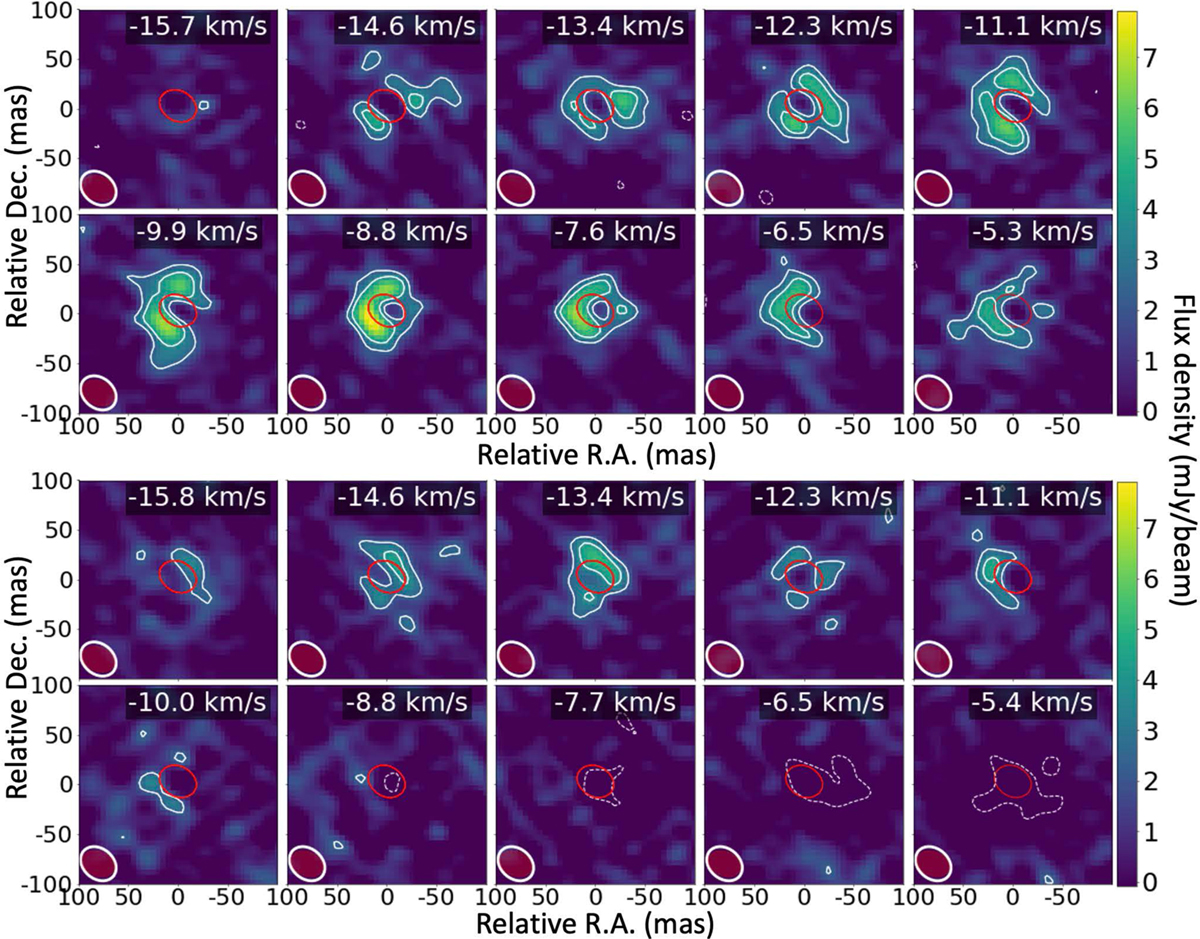
High resolution channel maps of the (0,0,1) 31,3–22,0 and (0,2,0) 143,12–134,9 transitions of water near 254 GHz in R Hya. The upper and lower panels correspond tothe 254.040 GHz and 254.053 GHz transitions, respectively (lines 7 and 8 in Table 2). Caption as in Fig. 6 except for the velocity range and the line peak, 8 mJy/beam; the typical r.m.s. noise is 1 mJy/beam. The HPBW is (39 × 30) mas at PA 49° and (34 × 25) mas at PA 67° for the line and continuum, respectively.
Current usage metrics show cumulative count of Article Views (full-text article views including HTML views, PDF and ePub downloads, according to the available data) and Abstracts Views on Vision4Press platform.
Data correspond to usage on the plateform after 2015. The current usage metrics is available 48-96 hours after online publication and is updated daily on week days.
Initial download of the metrics may take a while.