Fig. 6
Download original image
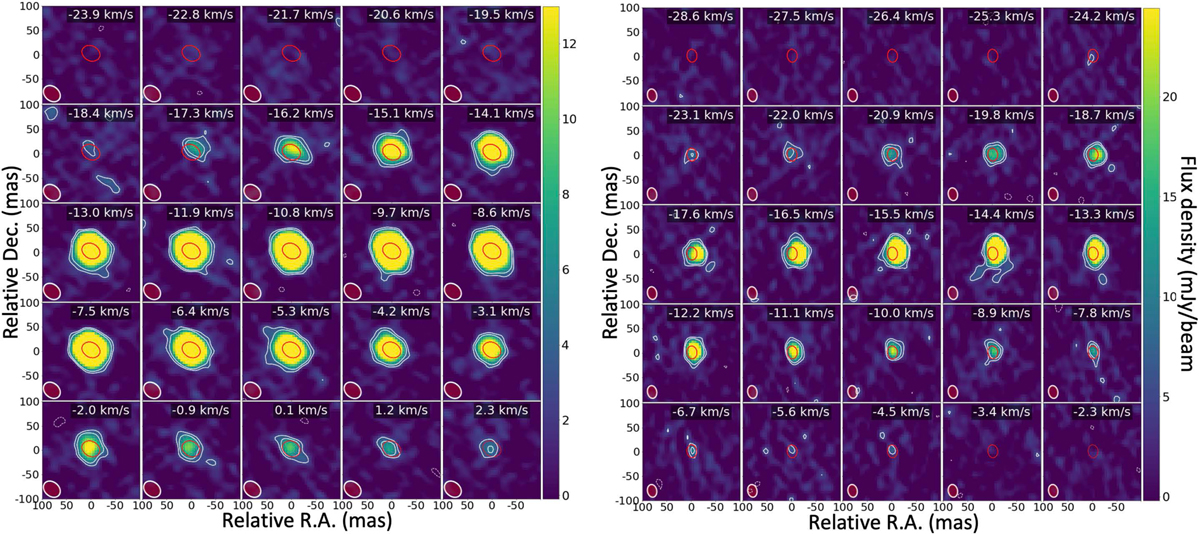
High resolution channel maps of H2O (0,2,0) 65,2–74,3 transition at 268.149 GHz in R Hya and U Her. Each map (R Hya and U Her, left and right panels) shows offsets in the R.A. and Dec. directions which we call throughout this work “Relative RA” and “Relative Dec”. The corresponding angular offsets cover 100 × 100 mas from the continuum emission peak at (0,0) position (coordinates given in Table 1). Each channel velocity is in the LSR frame from −23.9 to 2.3 km s−1 (R Hya) and −28.6 to −2.3 km s−1 (U Her). White light contours are at −3, 3 and 5σ. A few negative contours, when present, are dashed. The line peak and typical rms noise are 65 and 1 mJy beam−1 (R Hya), and 122 and 1.5 mJy beam−1 (U Her). The red contour at (0,0) delineates the extent at half peak intensity of the continuum emission. We characterize the elliptical Gaussian clean beams by their major and minor axes and position angle (PA) at half power, hereafter HPBW clean beam parameters. For the line observations of R Hya and U Her, these are (38 × 29) mas at PA 48° and (26 × 19) mas at PA 11°, respectively. The corresponding continuum parameters are (34 × 25) mas at PA 67° for R Hya and (24 × 18) mas at PA 8° for U Her. The line and continuum beams are shown at the bottom left of each map in white and solid dark-red, respectively. The scale of the line flux density per beam (in mJy beam−1) is linear and shown in the vertical bar on the right side of each channel map.
Current usage metrics show cumulative count of Article Views (full-text article views including HTML views, PDF and ePub downloads, according to the available data) and Abstracts Views on Vision4Press platform.
Data correspond to usage on the plateform after 2015. The current usage metrics is available 48-96 hours after online publication and is updated daily on week days.
Initial download of the metrics may take a while.