Fig. D.13
Download original image
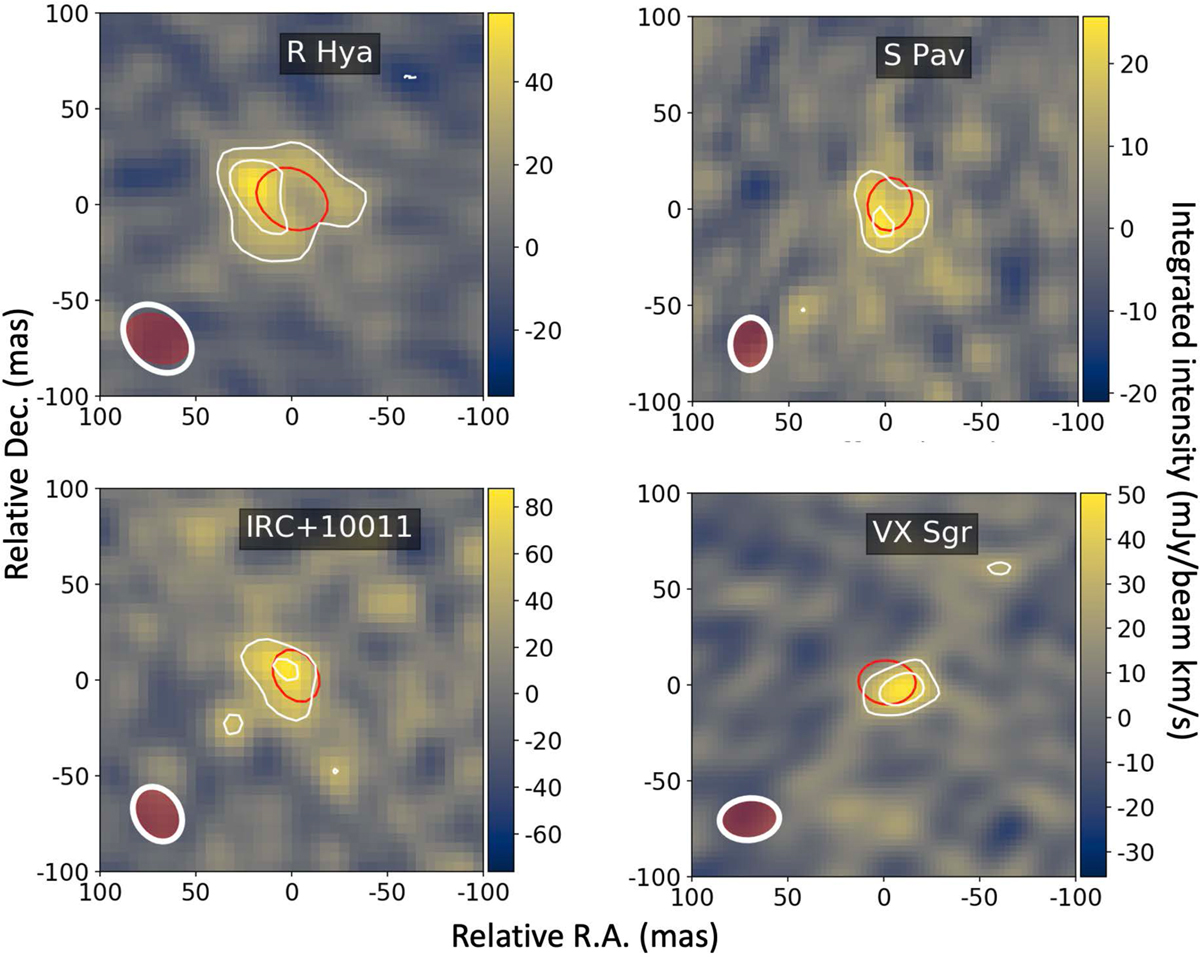
Zeroth moment emission maps of the (0,3,0) 83,6–74,3 transition of ortho H2O at 222.014 GHz toward R Hya, IRC+10011, VX Sgr and S Pav for the extended array configuration. The map field of view is 100×100 mas for all sources. The white contours are for 3 and 5σ emission. The red contour at the map center delineate the extent: at half peak intensity of the continuum emission. The noise tevel is 77.4, 16).0, 7.8 and 4.5 mJy/beam.km/s for R Hya, IRC+10011, VX Sgr and S Pav, respectively. The line HPBW (white ellipse) is, (41×30) mas at PA 45°, (30×24) mas at PA 30°, (31×22)) mas at PA −84° and (27×21) mai; at. PA −3° in R Hya, IRC+12011, VX Sgr and S Pav, respectively. The associated continuum HPBW (darK-red ellipse) is (34×25) mas at PA 67°, (27×19) mas at PA 31°, (28×20) mas at PA 89° and (25×20) mas at PA −13°. (Maps are integrated over −10.8 to −5.2, 14 to 15.9, −0.7 to 13.8 and −26.0 to −14.1 km s−1 for R Hya, IRC+10011, VX Sgr and S Pav, respectively.)
Current usage metrics show cumulative count of Article Views (full-text article views including HTML views, PDF and ePub downloads, according to the available data) and Abstracts Views on Vision4Press platform.
Data correspond to usage on the plateform after 2015. The current usage metrics is available 48-96 hours after online publication and is updated daily on week days.
Initial download of the metrics may take a while.