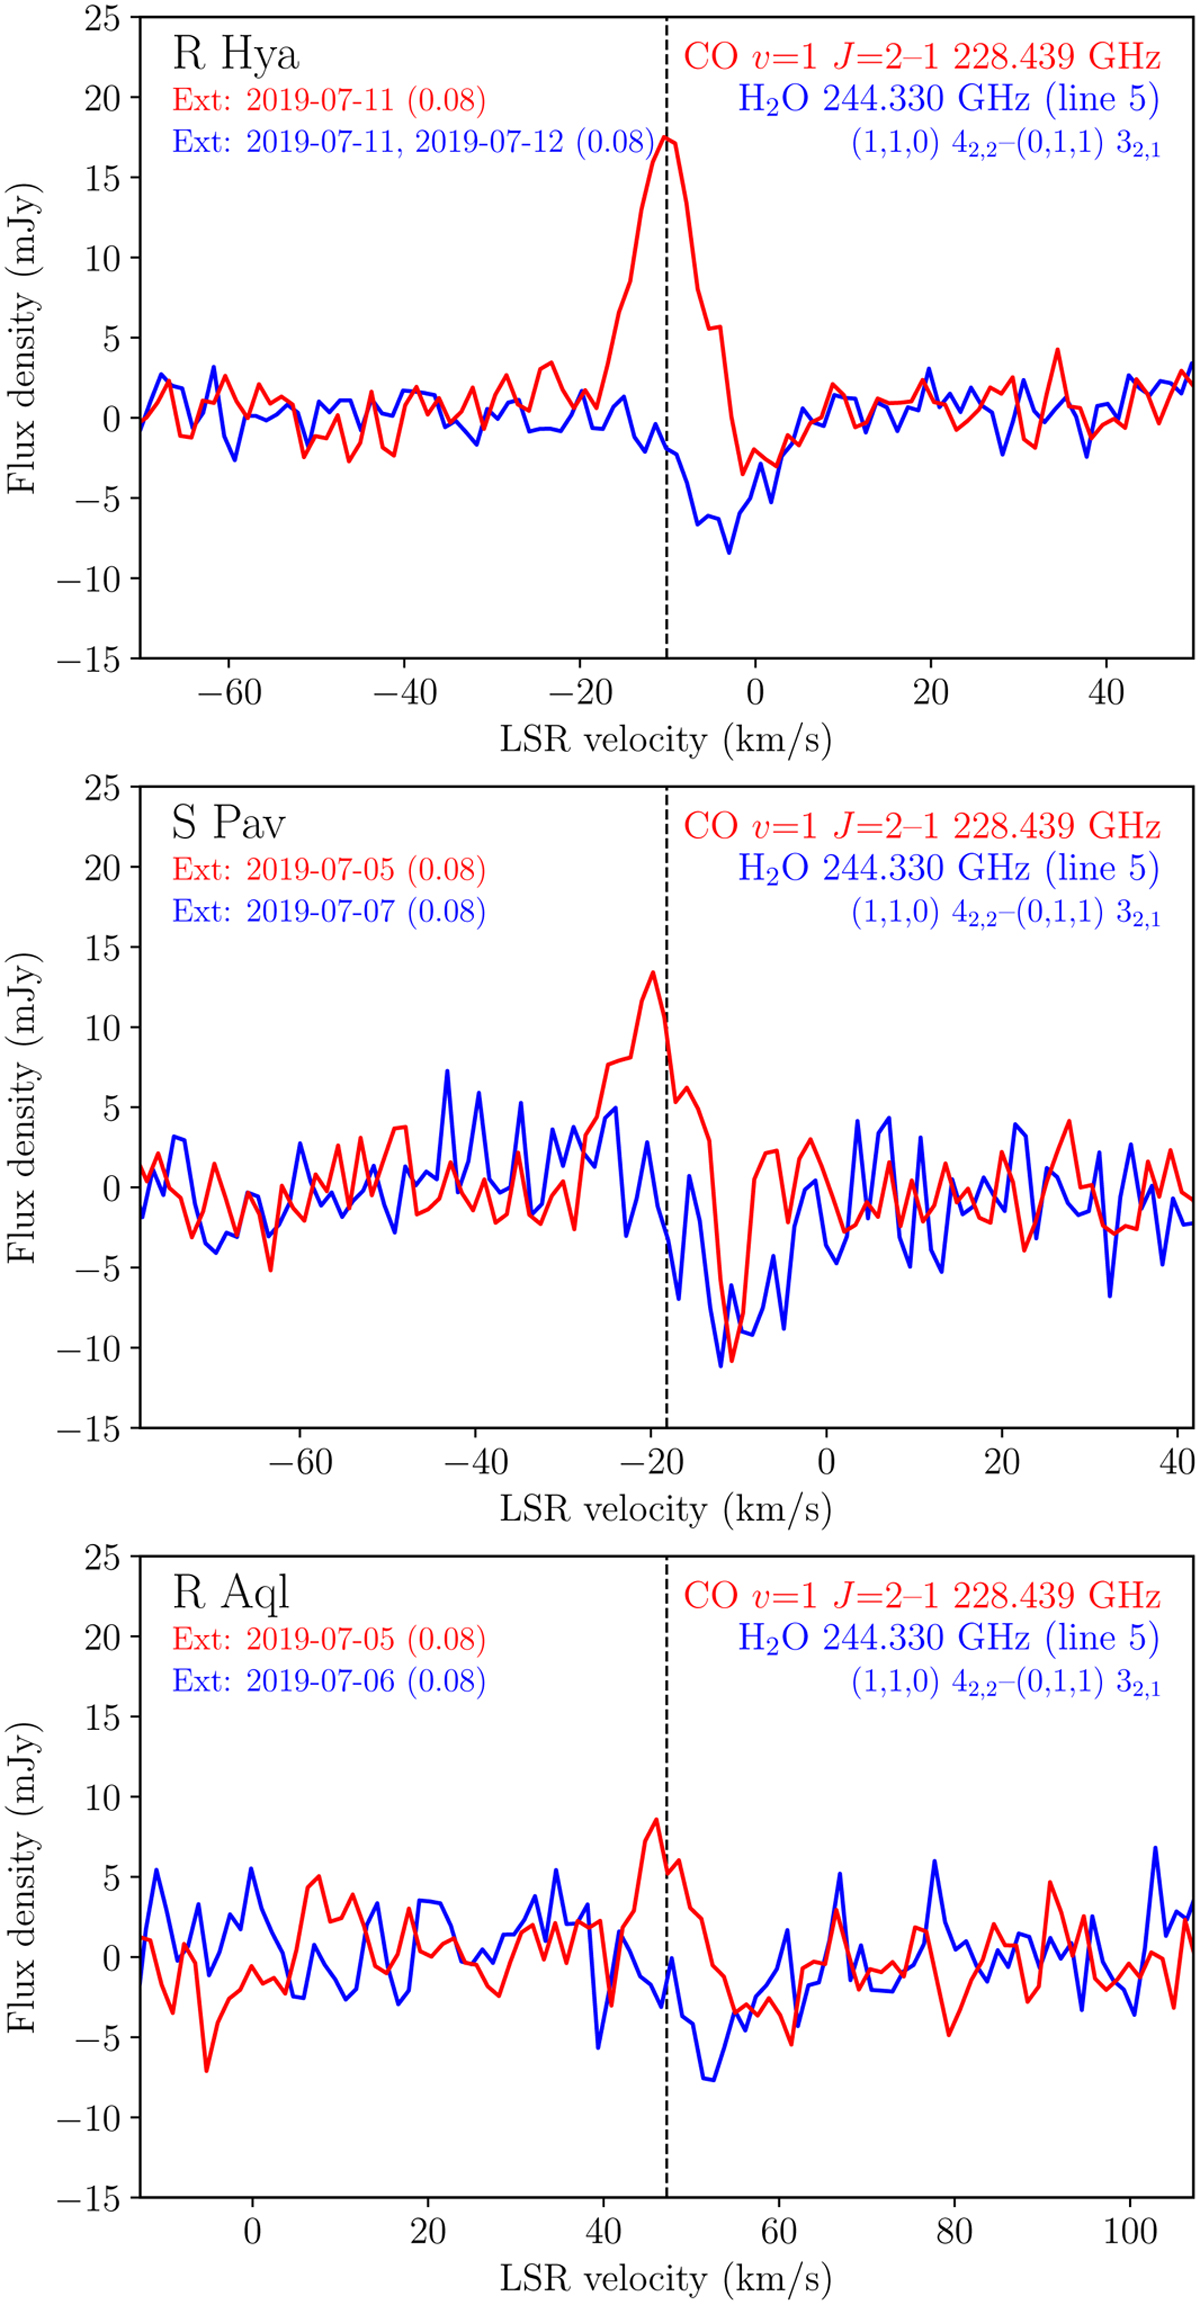
Fig. 5
Download original image
Absorption spectra of para H2O at 244.330 GHz in R Hya, S Pav and RAql (blue profiles) and, emission/absorption spectra of the υ = 1 transition of CO(2−1) at 228.439 GHz in the same sources (red profiles). The spectra are converted from the observed frequency to the LSR systemic velocity using the H2O line 5 (Table 2) and υ = 1, CO(2−1) rest frequencies. All spectra are extracted from the high resolution data cubes for an aperture diameter of 0.′′08. The vertical black dotted lines indicate the adopted new LSR systemic velocities (see Table 1).
Current usage metrics show cumulative count of Article Views (full-text article views including HTML views, PDF and ePub downloads, according to the available data) and Abstracts Views on Vision4Press platform.
Data correspond to usage on the plateform after 2015. The current usage metrics is available 48-96 hours after online publication and is updated daily on week days.
Initial download of the metrics may take a while.