Fig. D.10
Download original image
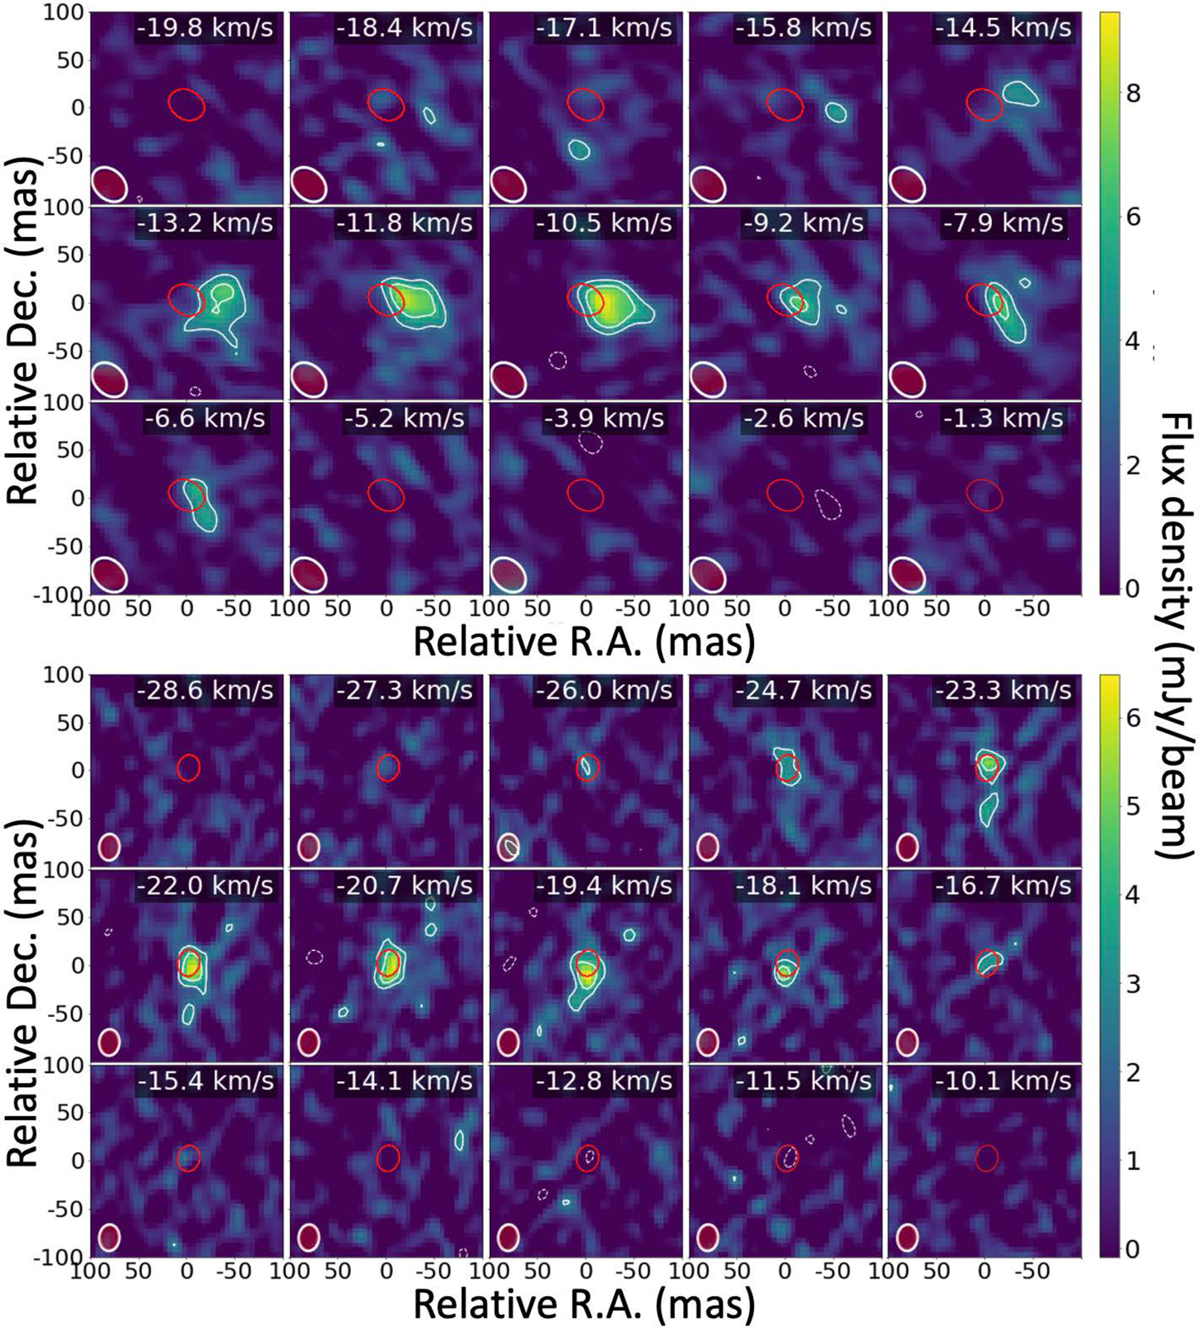
High resolution channel maps of high energy (8331 K) (0,3,0) 83,6–74,3 transition of H2O at 222.014 GHz in R Hya and S Pav (upper and lower panels). Caption as in Fig. 6 except for the velocity range and the line peak flux density, 9.3 and 6.5 mJy/beam in R Hya and S Pav, respectively; the typical r.m.s. noise is ~1 mJy/beam in both stars. The LSR velocity in each panel is determined from our own rest frequency, 222017.31 MHz, whose uncertainty is low compared to that in W2020 (see Table 2). The HPBW is (41×30) mas at PA = 45° and (34×25) mas at PA = 67° for the line and continuum in R Hya, respectively, and (27×21) mas at PA −3° (line) and (25×20) mas at PA −13° (continuum) in S Pav.
Current usage metrics show cumulative count of Article Views (full-text article views including HTML views, PDF and ePub downloads, according to the available data) and Abstracts Views on Vision4Press platform.
Data correspond to usage on the plateform after 2015. The current usage metrics is available 48-96 hours after online publication and is updated daily on week days.
Initial download of the metrics may take a while.