Fig. 4
Download original image
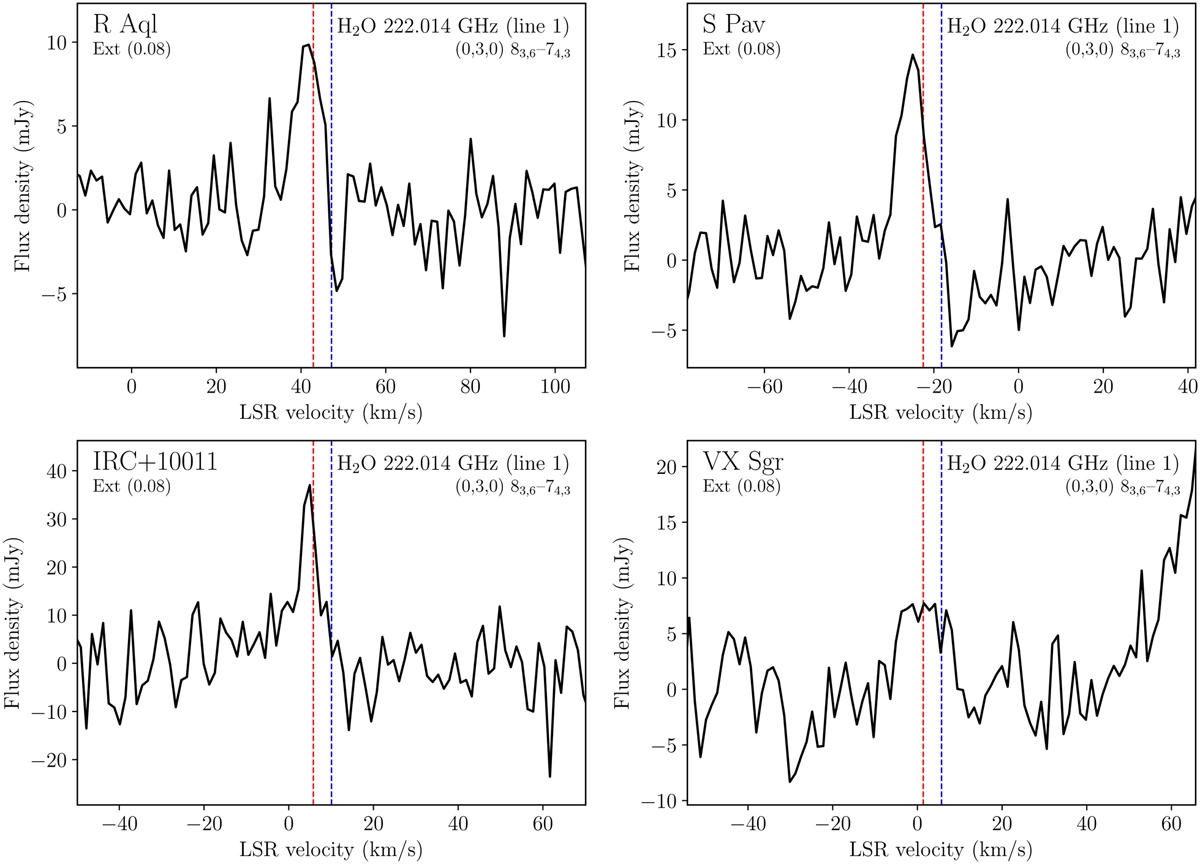
Typical line profiles of the (0,3,0) 83,6 – 74,3 transition of H2O at 222.014 GHz in R Aql, S Pav, IRC+10011 and VX Sgr. The upper left panel in Fig. 3 shows the same transition in R Hya. Spectra are extracted for an aperture diameter of 0.′′ 08 from the extended configuration and converted from the observed frequency to the LSR frame using the H2O catalog; line rest frequency given in Table 2. The red and blue vertical lines indicate the new LSR systemic velocity (see Table 1) corresponding to our frequency determination and to the catalog frequuncy, respectively. The spectral resolution is ~1.3 km s−1.
Current usage metrics show cumulative count of Article Views (full-text article views including HTML views, PDF and ePub downloads, according to the available data) and Abstracts Views on Vision4Press platform.
Data correspond to usage on the plateform after 2015. The current usage metrics is available 48-96 hours after online publication and is updated daily on week days.
Initial download of the metrics may take a while.