Fig. 3
Download original image
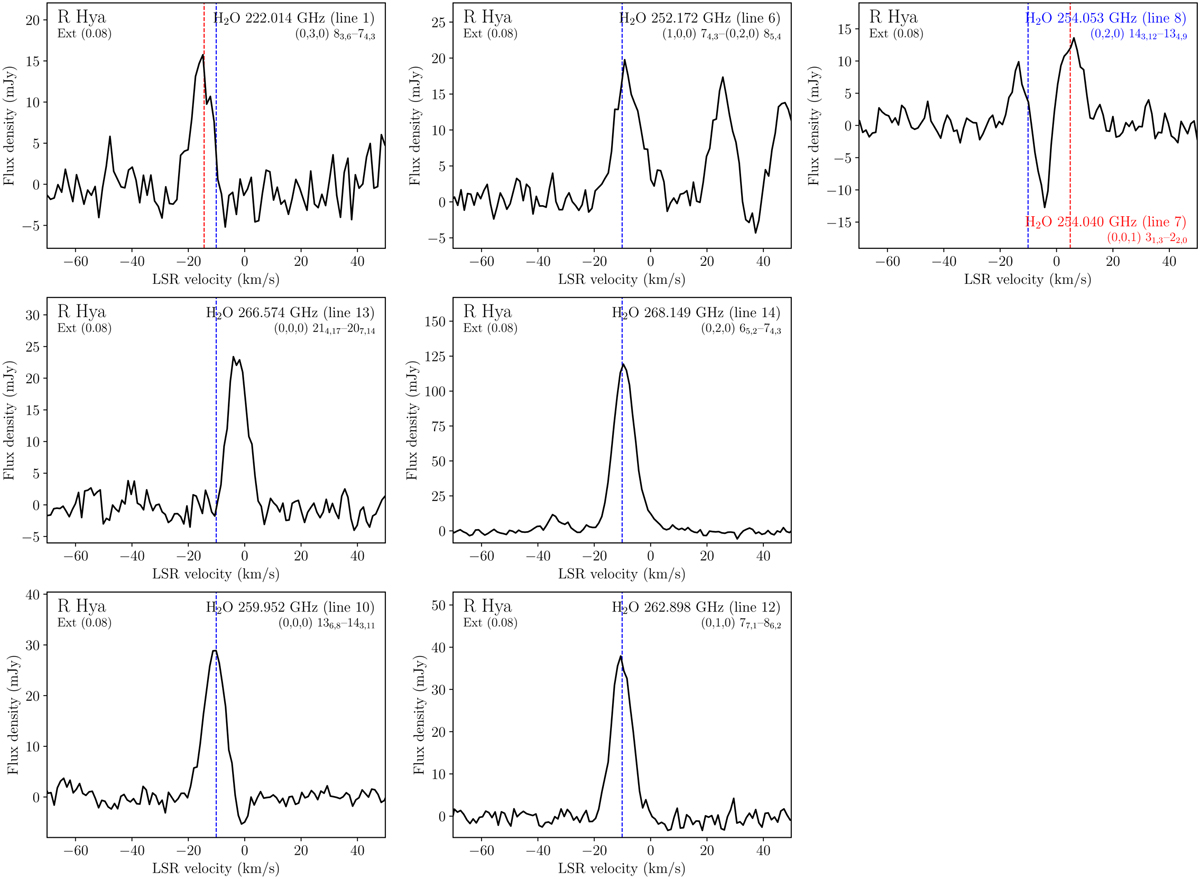
Water line profiles extracted from the extended configuration of the main array for an aperture diameter of 0.′′08 in R Hya. First two rows: six transitions of ortho H2O as defined in Table 2: lines 1, 6, 8 (including line 7 separated by 12.7 MHz, or 15.0 km s−1, from line 8) and lines 13 and 14. Last row: two transitions of para H2O as defined in Table 2: lines 10 and 12. The spectra are converted from the observed frequency to the LSR frame using the H2O catalog Une rest frequencies given in Table 2. In all spectra, the blue vertical line indicates the adopted new LSR systemic velocity as shown in Table1. For line 1 (upper left panel), file red verticad line shows the LSR velocity for the slightly different frequency determined in this work. Spectral resolution varies from ~1.1 km s−1 (268 GHz) to ~1.3 (222 GHz) km s−1.
Current usage metrics show cumulative count of Article Views (full-text article views including HTML views, PDF and ePub downloads, according to the available data) and Abstracts Views on Vision4Press platform.
Data correspond to usage on the plateform after 2015. The current usage metrics is available 48-96 hours after online publication and is updated daily on week days.
Initial download of the metrics may take a while.