Fig. 24
Download original image
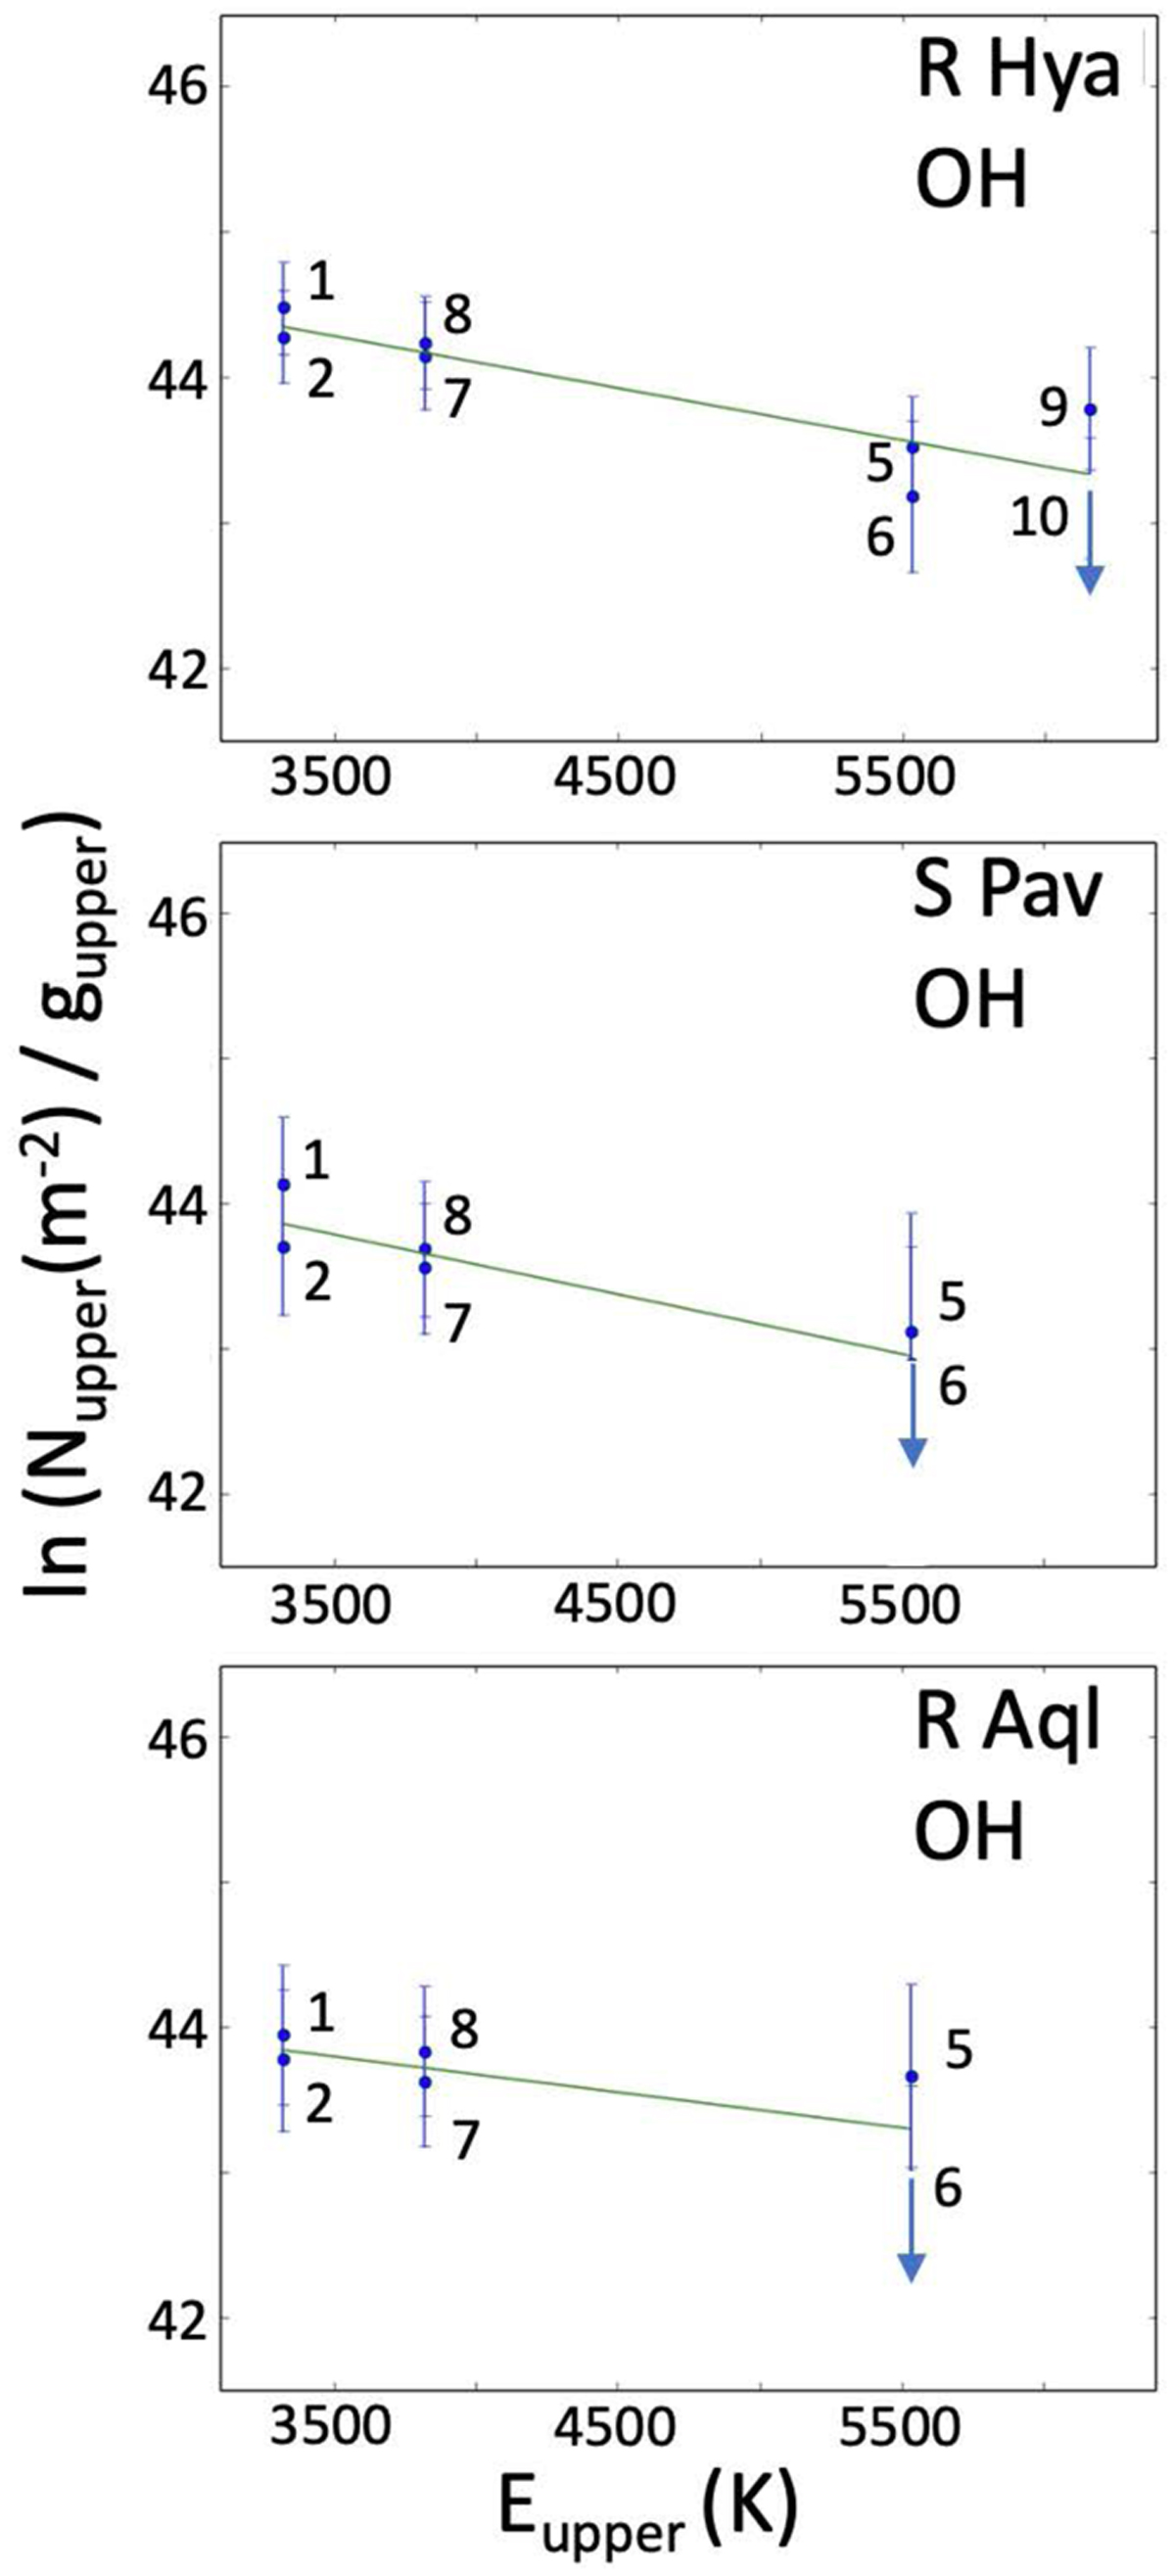
OH population diagram for R Hya, S Pav and R Aql. The number near each data point is the line number used in Table 3 of observable OH transitions. The vertical bar in each data point includes the ±1σ formal error of the integrated flux density and a rough estimate of the filling factor uncertainty. (An arrow indicate an upper limit.) Τhe green line is the regression line across the data points (see Sect. 9.2).
Current usage metrics show cumulative count of Article Views (full-text article views including HTML views, PDF and ePub downloads, according to the available data) and Abstracts Views on Vision4Press platform.
Data correspond to usage on the plateform after 2015. The current usage metrics is available 48-96 hours after online publication and is updated daily on week days.
Initial download of the metrics may take a while.