Fig. 23
Download original image
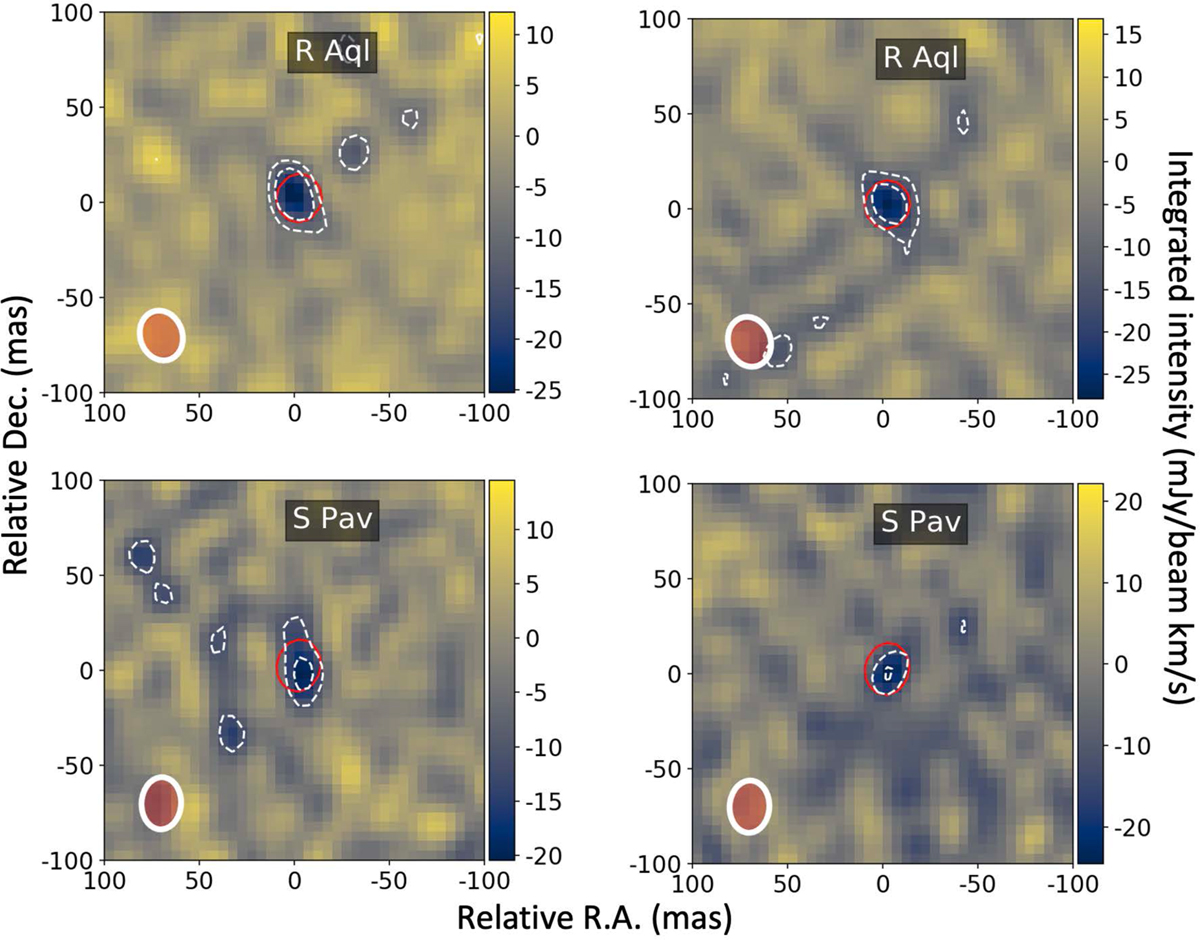
Zeroth moment map of OH absorption in the J = 27/2, F′ – F″ = 14–14 and 13–13 transitions. Leftpanels: F′– F″ = 14–14 transition in R Aql and S Pav. Right panels: F′ – F″ = 13–13 transition in the same sources. Offsets in RA and Dec. directions are relative to the coordinates of the peak stellar− continuum as given in Tattle 1. The velocity intervals in the F′ – F″ = 14–14 and 13–13 transitions are: 55.8 to 61.2 km s−1 and 56.2 to 66.2 km s−1 in R Aql; −10.2 to −3.6 km s−1 and −9.4 to 33.5 km s−1 in S Pav The dotted white contours are at −33 and −5σ The red contour delineates the extent at half peak intensity of the continuum emission. The line and continuum beams are shown at the bottom left of each map in white and dark-red, respectively. The line HPBW is (27 × 22 mas) at PA 18° and (27 × 21) mas at PA −3° in R Aql and S Pav, respectively. The continuum beam is (24 × 22 mas at: PA −13 (R Hya) and (25 × 20) mas at PA −13° (S Pav).
Current usage metrics show cumulative count of Article Views (full-text article views including HTML views, PDF and ePub downloads, according to the available data) and Abstracts Views on Vision4Press platform.
Data correspond to usage on the plateform after 2015. The current usage metrics is available 48-96 hours after online publication and is updated daily on week days.
Initial download of the metrics may take a while.