Fig. 21
Download original image
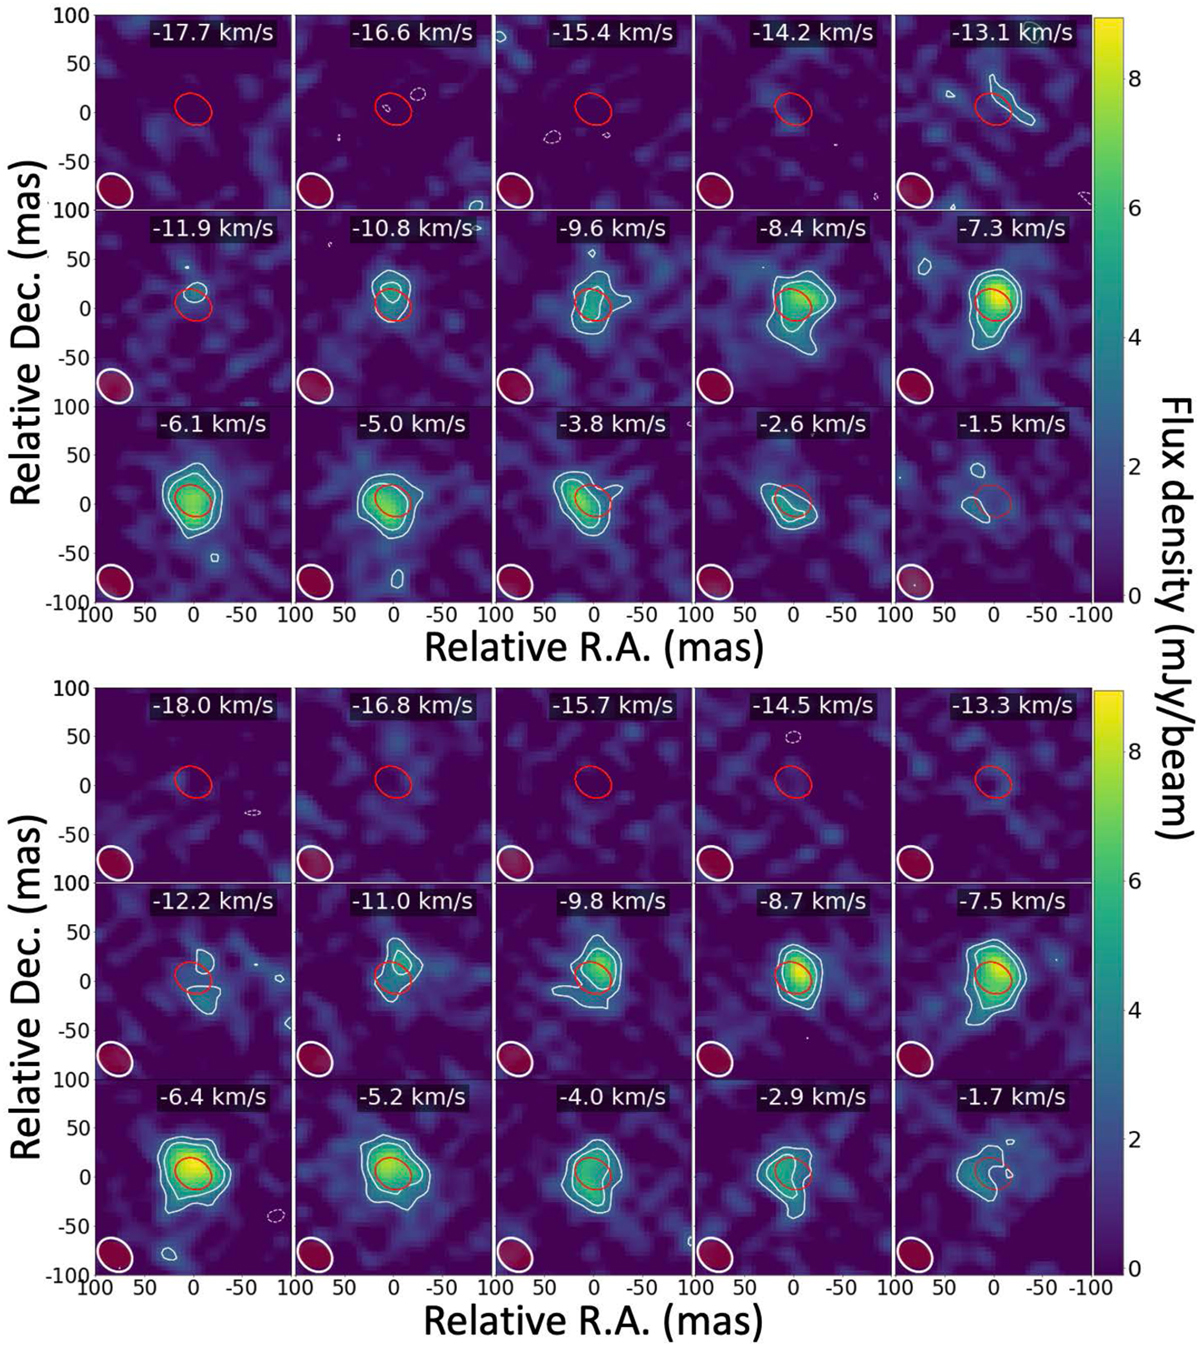
High resolution channel maps of J = 29/2, F′ – F″= 14 – 14 and 15–15 transitions of OH in R Hya (upper and lower panels, respectively). Each map covers 200 × 200 mas and is centered on the continuum emission peak at (0,0) position (coordinates given in Table 1). Each channel velocity is in the LSR frame using the OH catalog rest frequency in Table 3. The white contours are at −3, 3 and 5σ. The line peak flux density and the typical r.m.s. noise are 9 mJy beam−1 and 1 mJy beam−1, respectively. The red contour delineates the extent at half peak intensity of the continuum emission. The line and continuum beams are shown at the bottom left of each map in white and dark-red, respectively. The HPBW is (39 × 31) mas at PA 46° and (34 × 25) mas at PA 67° for line and continuum, respectively.
Current usage metrics show cumulative count of Article Views (full-text article views including HTML views, PDF and ePub downloads, according to the available data) and Abstracts Views on Vision4Press platform.
Data correspond to usage on the plateform after 2015. The current usage metrics is available 48-96 hours after online publication and is updated daily on week days.
Initial download of the metrics may take a while.